← Docs
Documentation
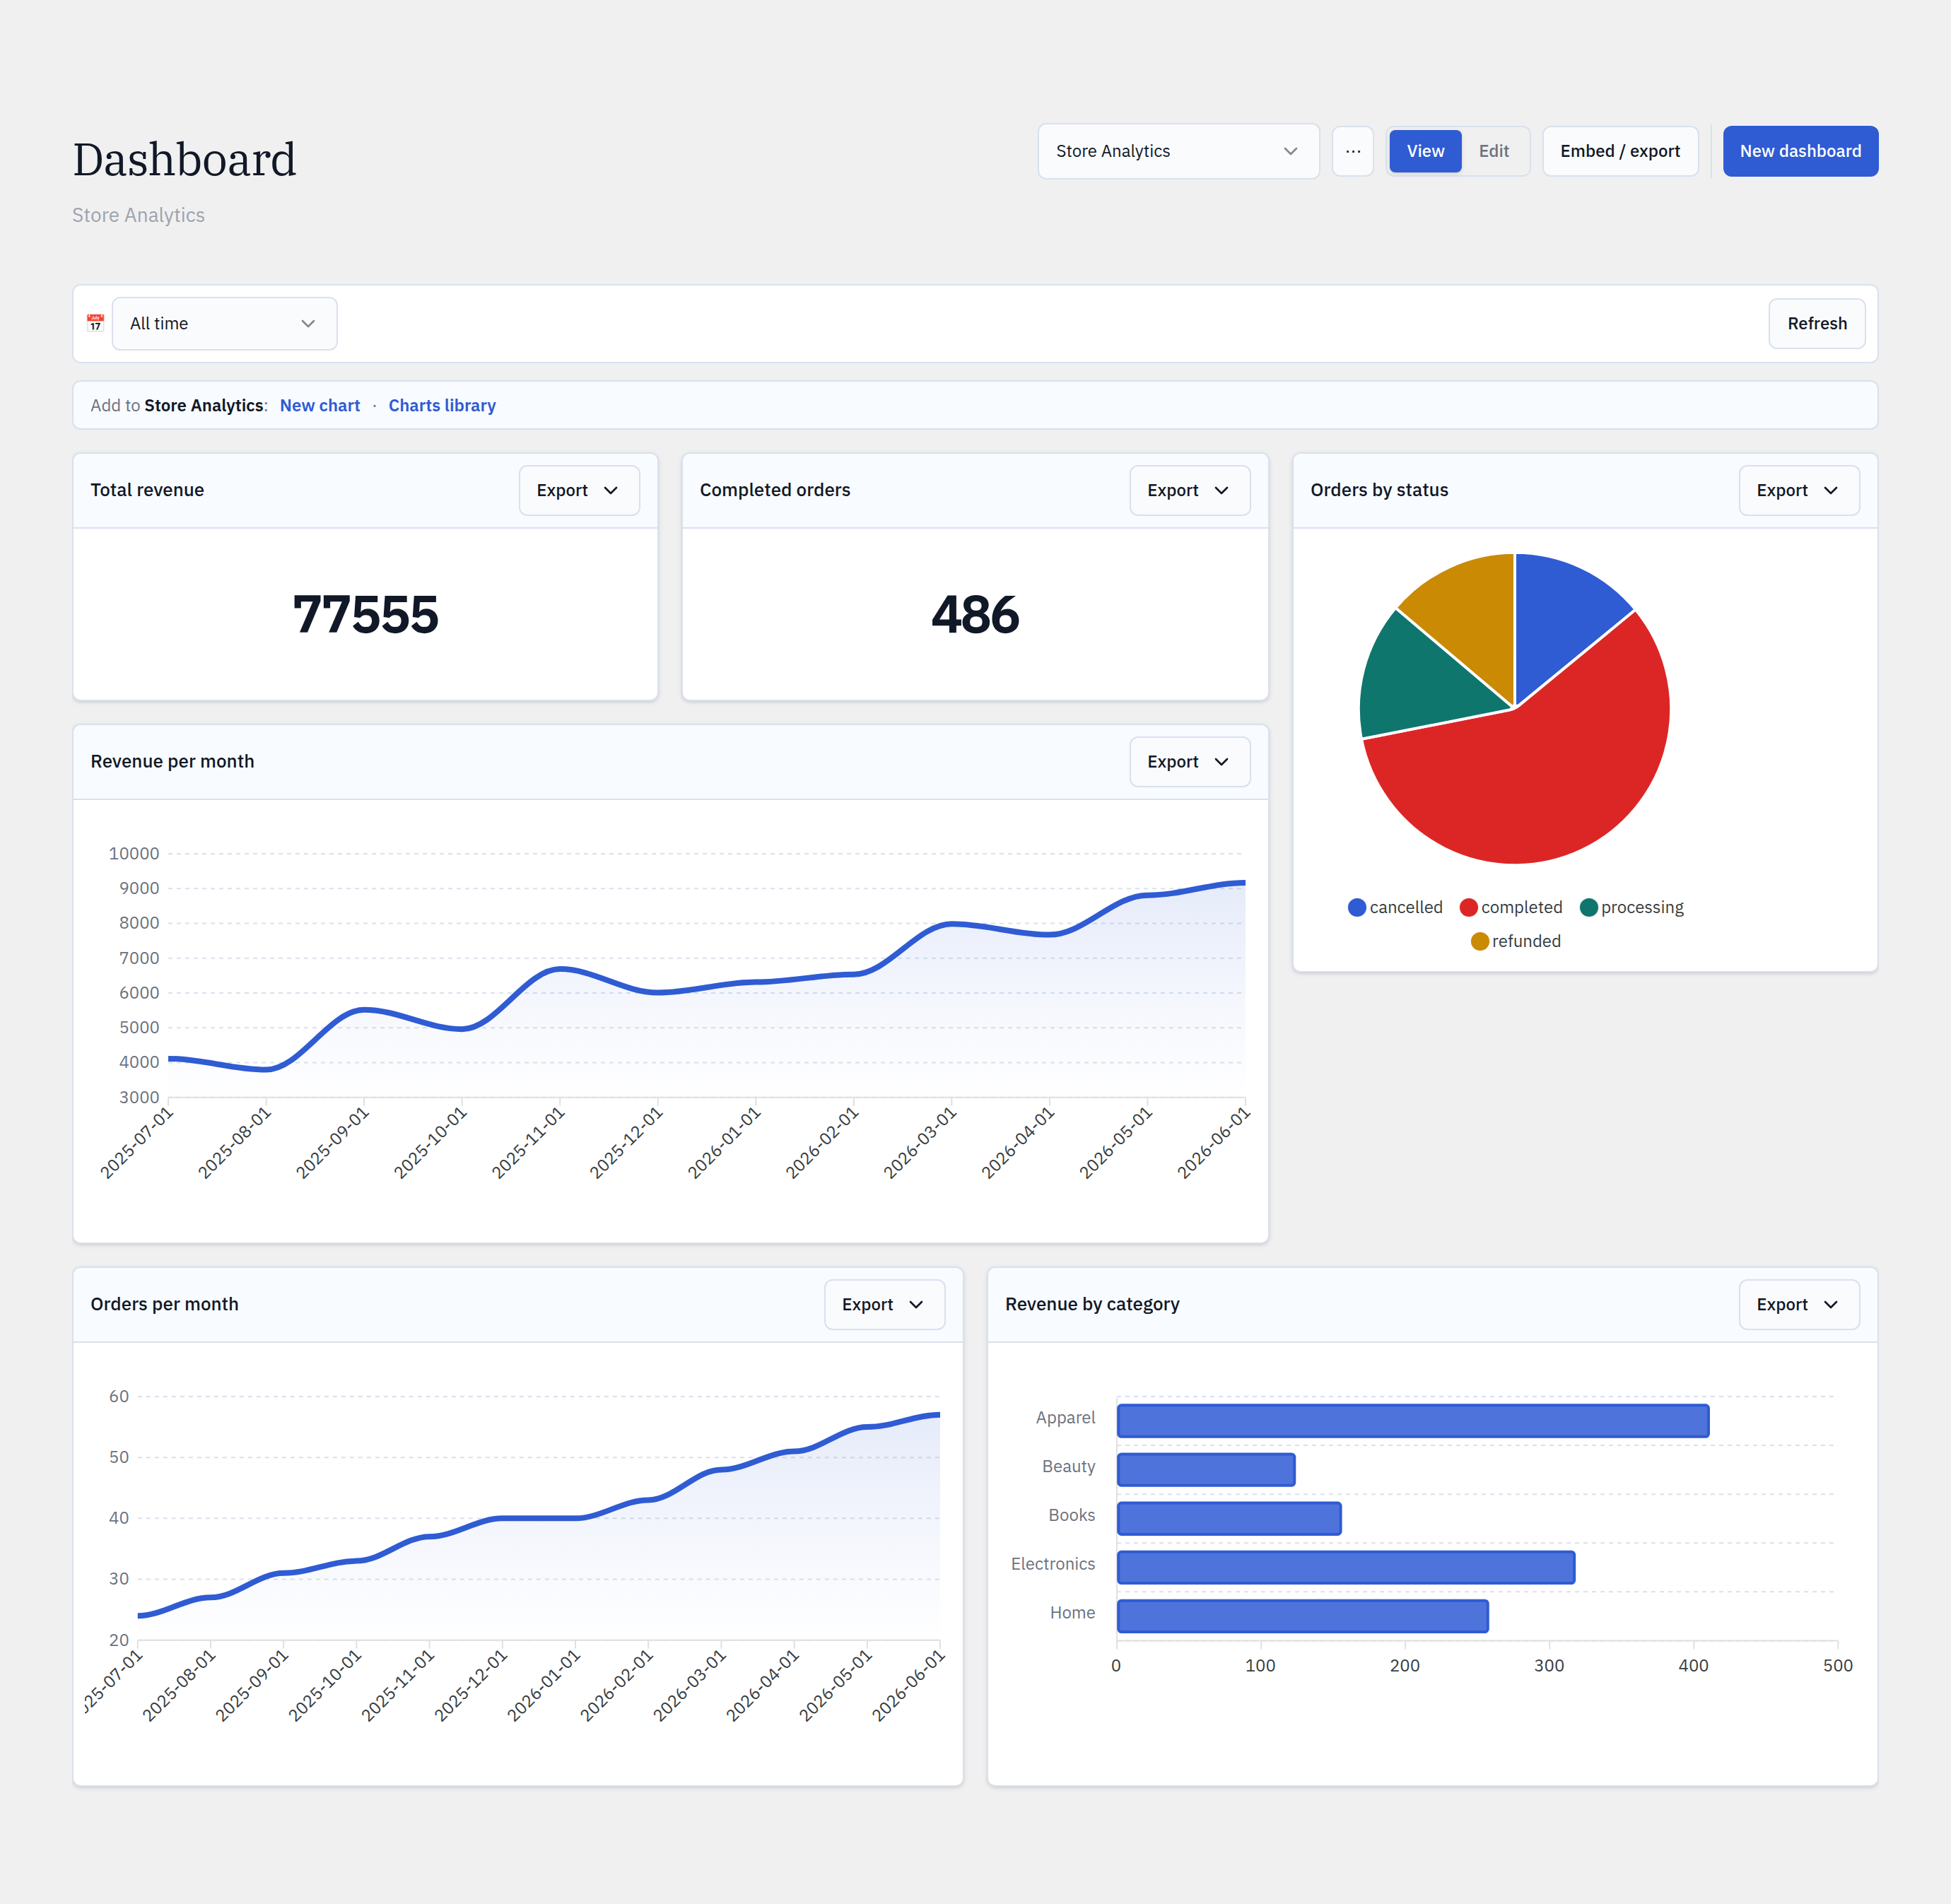
Dashboard filters
One global filter bar re-slices every chart on a dashboard at once — a date range and a time grain that each chart maps to its own date column.
Step by step
- 1Open a dashboard and find the filter bar at the top.
- 2Pick a date-range preset (Last 7 days, Last 30 days, This month, All time, …) or a custom range.
- 3Choose a time grain — Day, Week, Month, Quarter, or Year — to re-bucket time-series charts.
- 4Charts refresh together; each maps the range to its own date column.
- 5A chart can be exempted from the global filter if it shouldn’t be date-scoped.
yoursite.com/wp-admin/admin.php?page=glimpsebi-dashboard
How mapping works
When you pin a date-based chart, Glimpse BI infers which column and dimension the global range should drive (its “filter mapping”). You can adjust or exempt the mapping per chart, so a KPI that should always show all-time totals can opt out.
Runtime parameters
Filter values flow into charts as bound runtime parameters — including into SQL-mode charts via {{gbi:date_from}} / {{gbi:date_to}} placeholders. Nothing is string-concatenated into the query.
Reference
Range presetsToday · 7d · 30d · 90d · month · quarter · year · all-time · custom
Time grainsDay · Week · Month · Quarter · Year
Per-chartDate-column mapping or exempt
Into SQL{{gbi:date_from}} / {{gbi:date_to}}
Bring your WordPress data into focus.
Install the free plugin and build your first chart in minutes. Upgrade to Pro when you outgrow the caps.