Features
Everything you need to turn wpdb into dashboards.
Two ways to build, seven ways to visualize, dashboards anyone can filter, and a security model that keeps your data on your own server.
No-code builder
Build a chart without writing a query.
Schema introspection
Auto-discovers every table in your database — core, plugin, and custom — grouped and searchable, with heuristic join shortcuts surfaced for you.
Measures & dimensions
Count, Sum, or Average over any column; group by one or more dimensions; bucket date columns by hour, day, week, month, quarter, or year — no SQL.
Filters & relative dates
Filter on =, ≠, >, IN, BETWEEN, or IS NULL, including relative dates like “in the last N days” or “current month”.
Live preview + generated SQL
The chart redraws as you build, with exec time and row count — and you can pop open the exact SQL the GUI generated for full transparency.
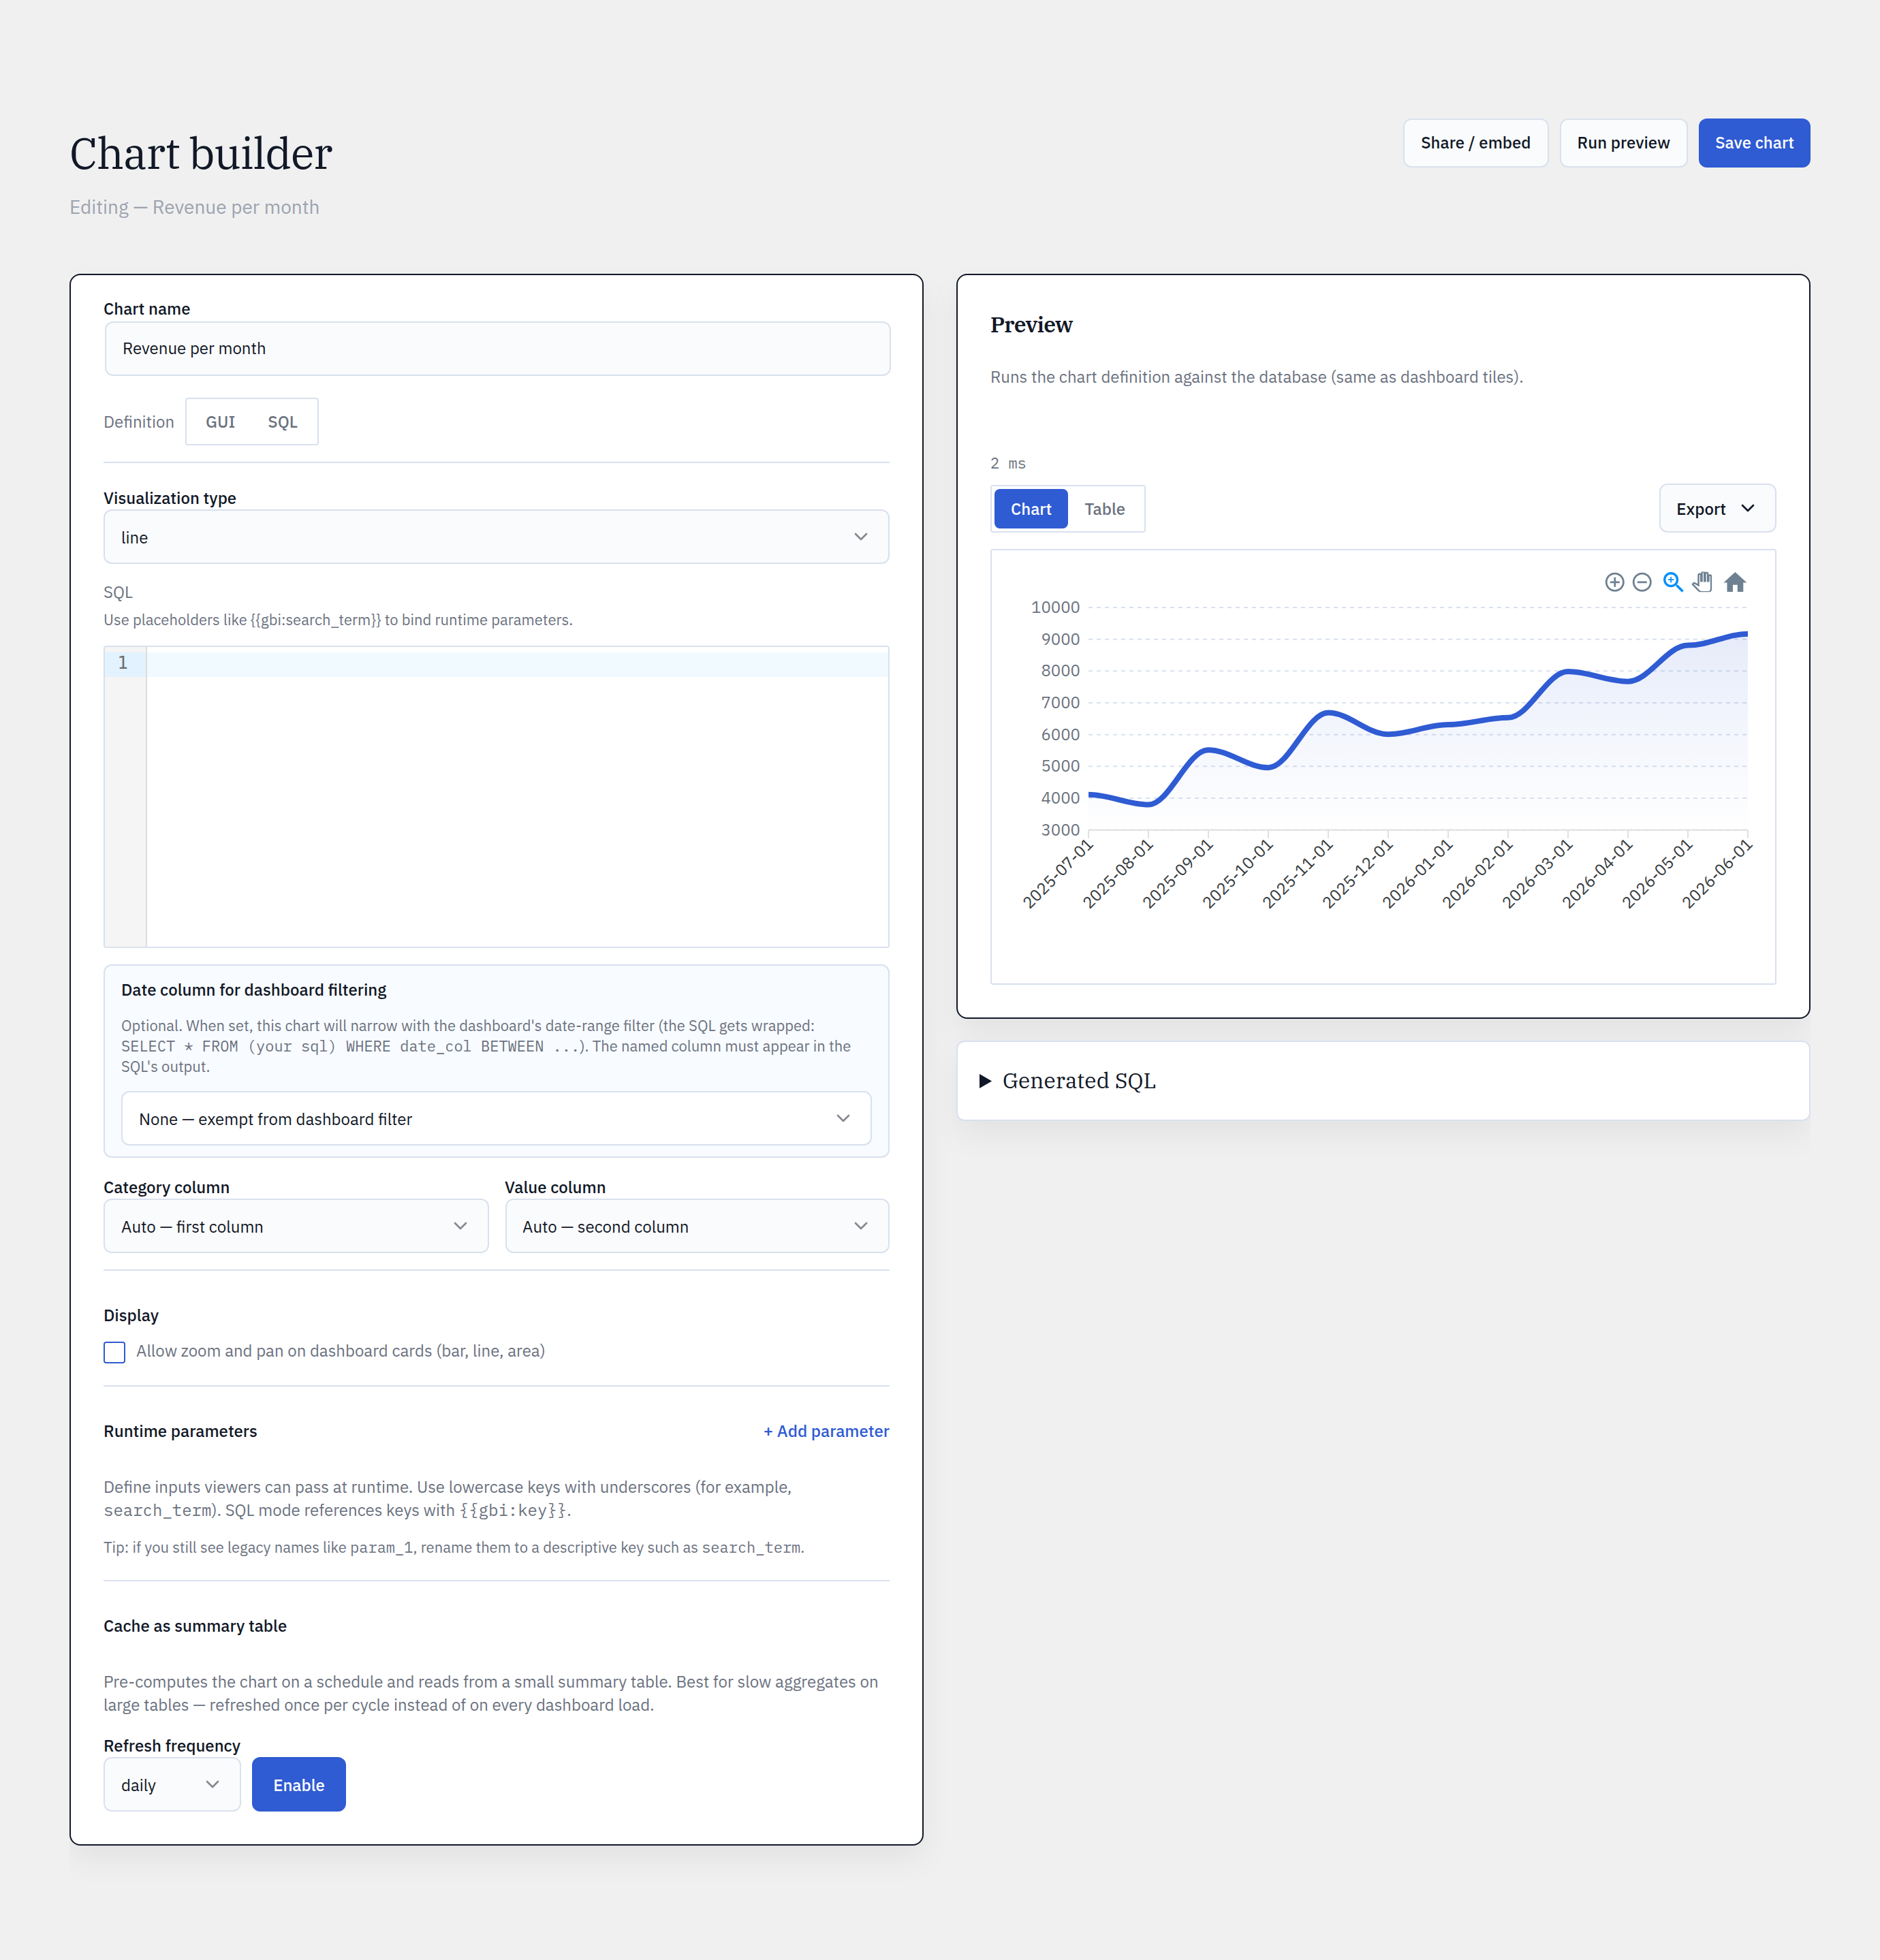
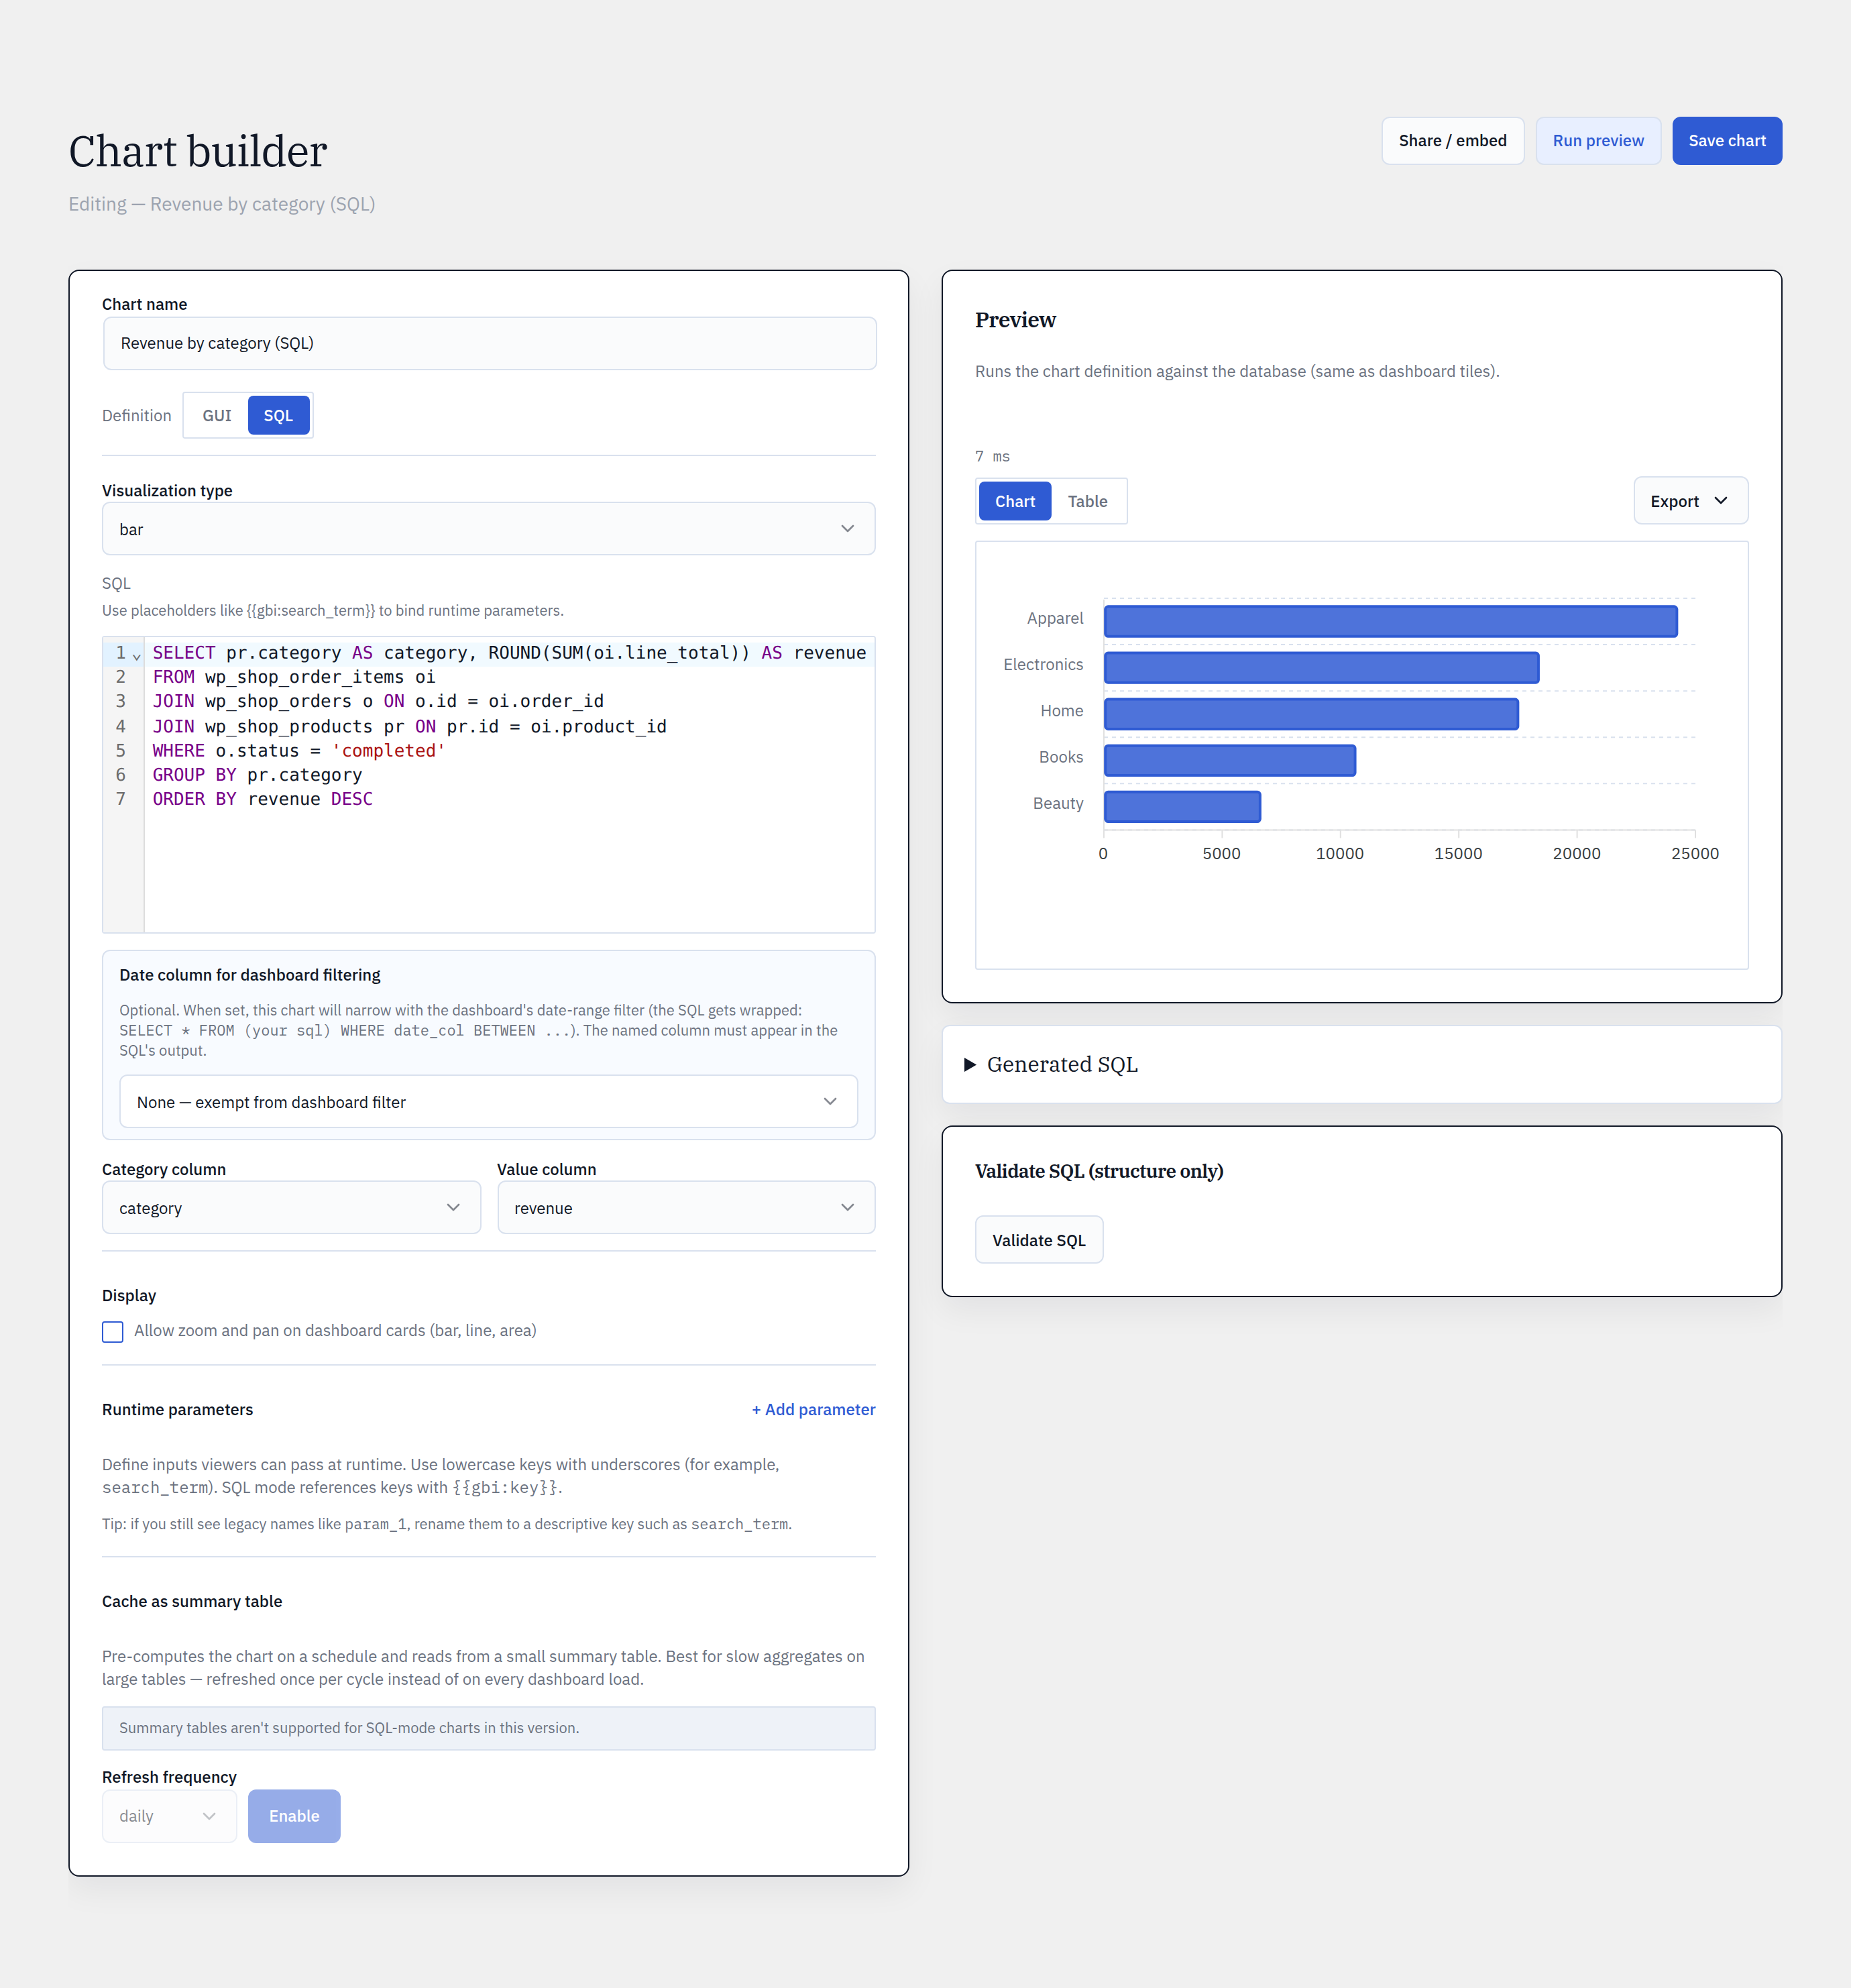
SQL mode
Drop to SQL when the GUI runs out of room.
Read-only by AST
Every query is parsed and validated — SELECT and WITH … SELECT only. No writes, file access, sleeps, or multi-statements ever run.
CodeMirror editor
Full syntax highlighting, with a one-click validate and a clear read-only badge before anything executes.
Runtime parameters
Inject dashboard filter values into your SQL with {{gbi:param}} placeholders — bound safely, never string-concatenated.
Graceful one-way switch
A GUI chart can graduate to SQL. If a SQL chart outgrows the GUI, the builder greys out rather than guessing — no broken round-trips.
Visualize
Seven chart types, one editorial theme.
The Funnel chart type ships with Pro. All charts merge the shared ApexCharts theme so a Glimpse BI chart looks the same on every site.
Dashboards
One filter bar re-slices every chart.
Global filter bar
One bar re-slices every chart on the dashboard by date range and time grain (day → year) — without ever touching the saved charts.
12-column drag-drop grid
Arrange charts on a responsive 12-column grid. Switch between View and Edit modes; drag, drop, and resize tiles into place.
One chart, many dashboards
Dashboards reference charts by ID — never copies. Edit a chart once and every dashboard it’s pinned to updates with it.
Fast by default
Charts fan out and load in parallel, results pass through a stale-while-revalidate cache, and a stampede lock prevents thundering-herd misses.
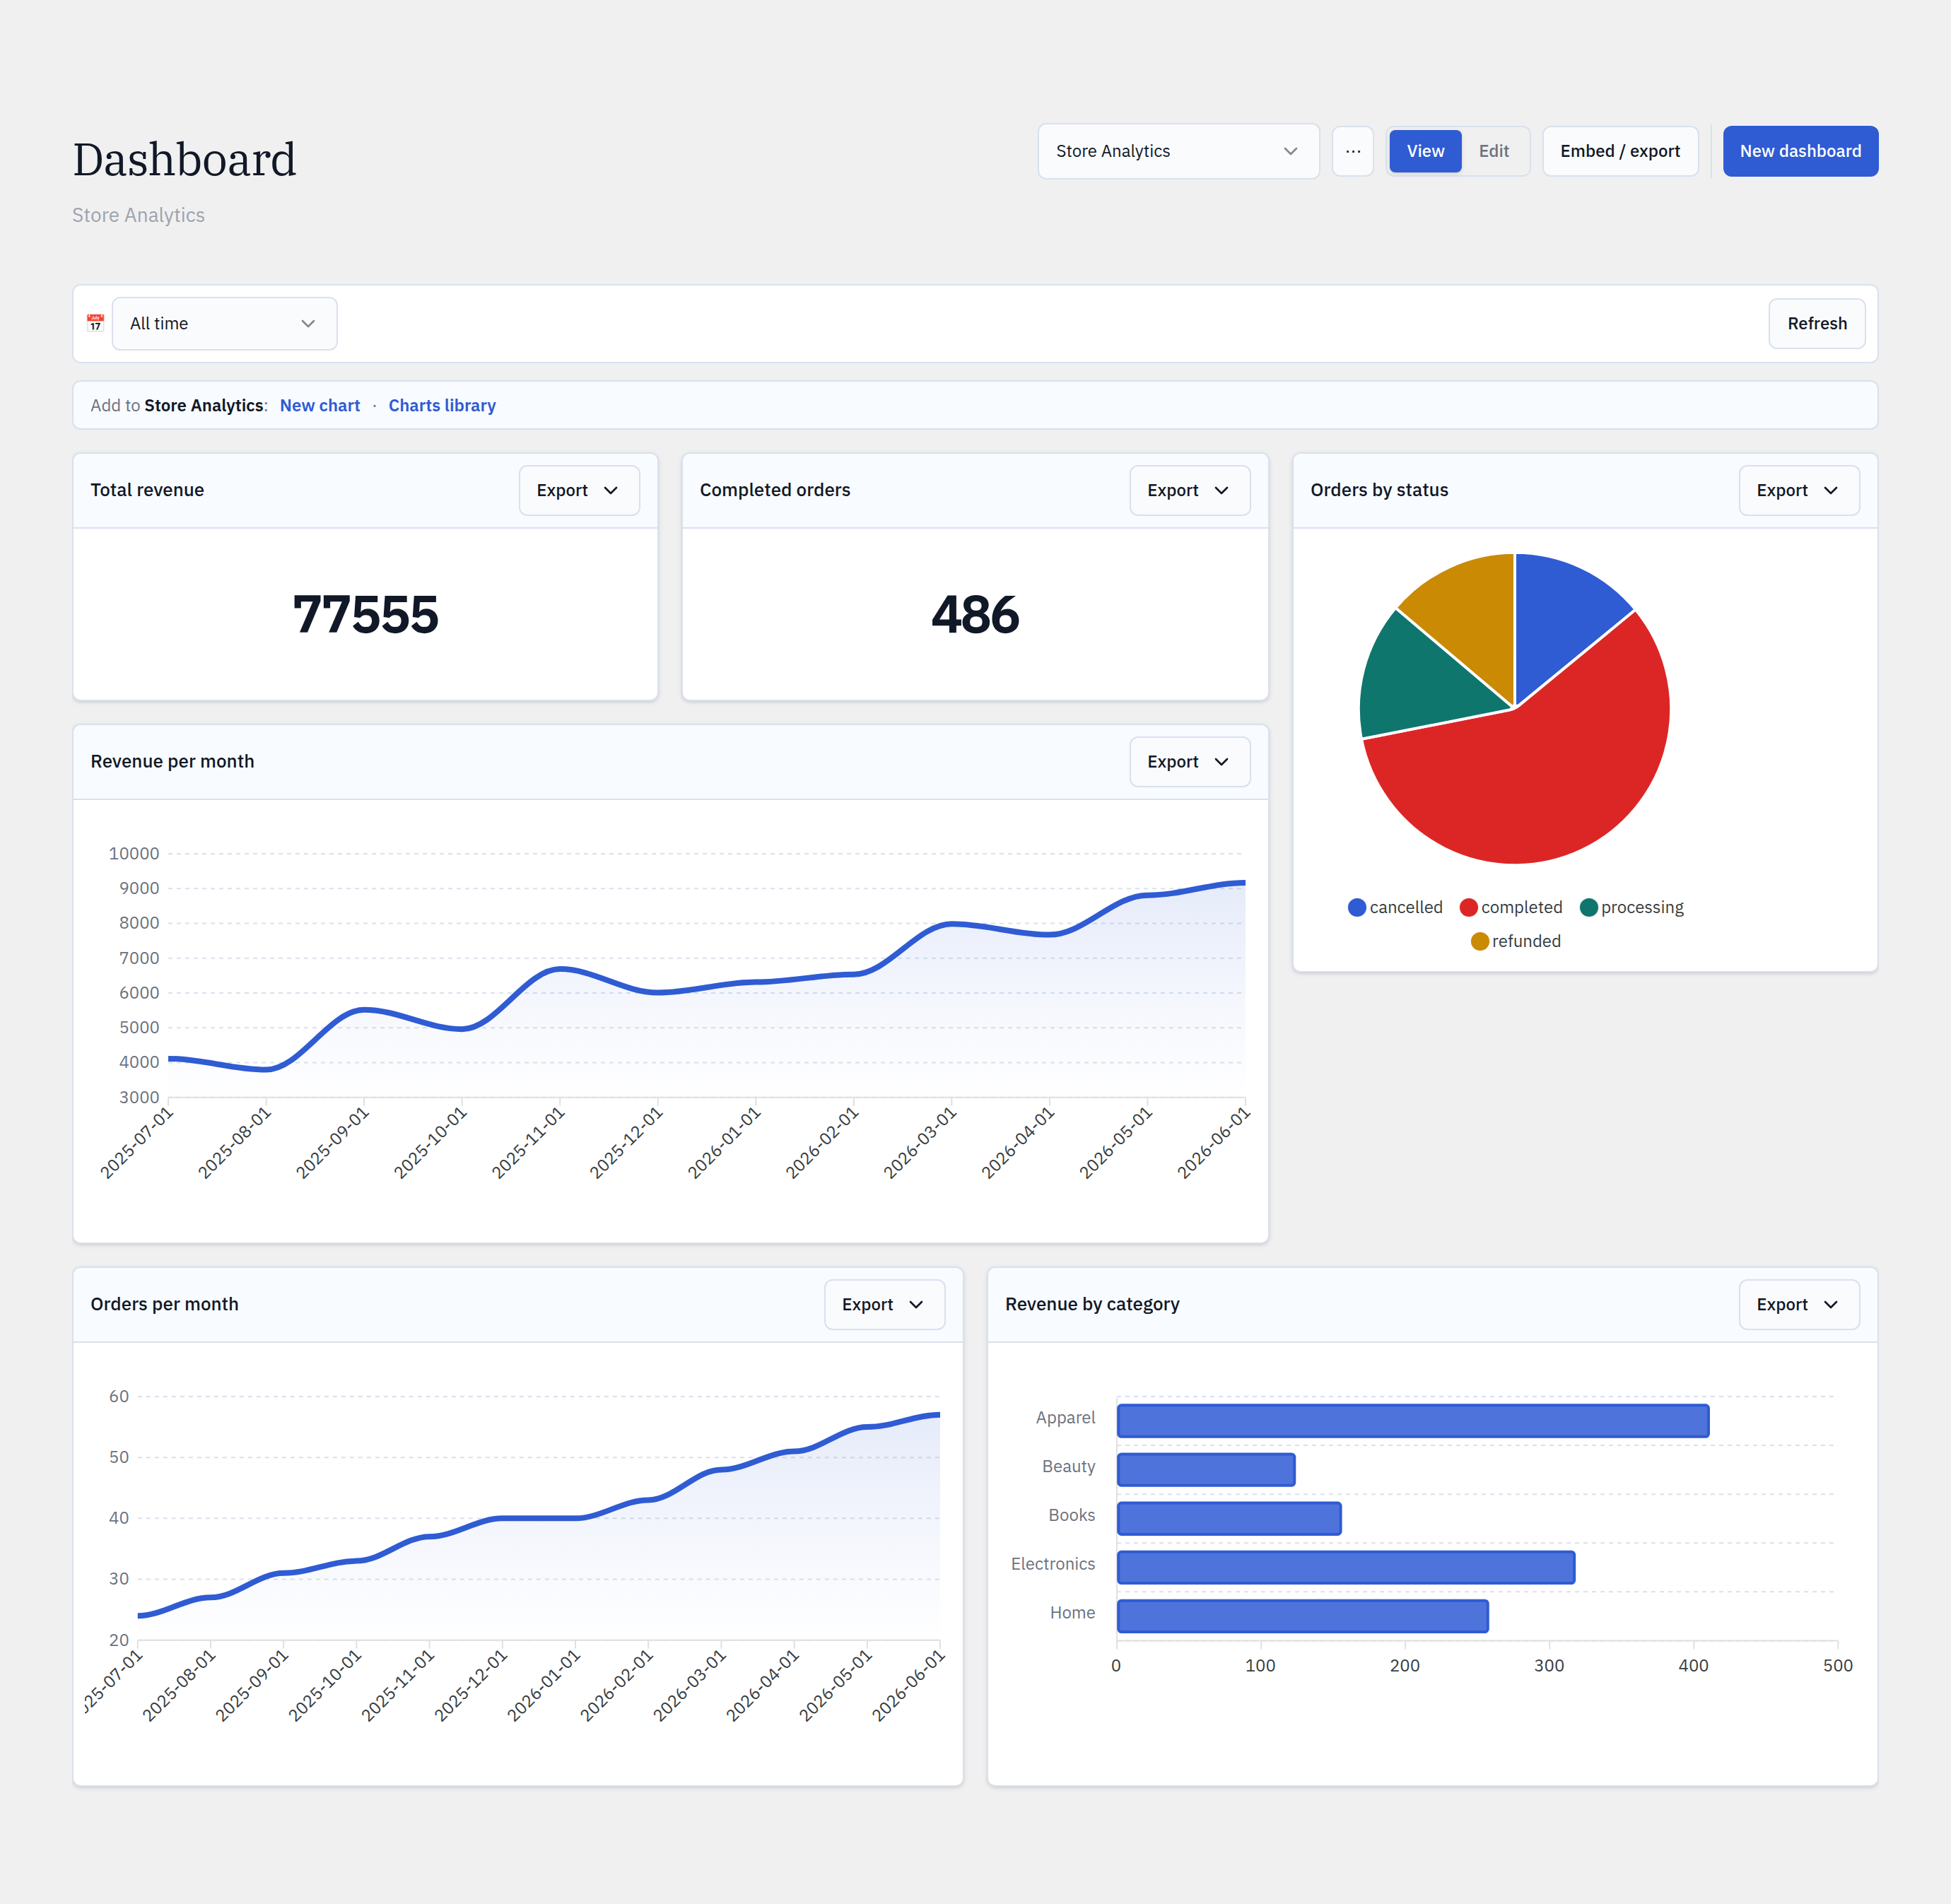
Chart library
Every saved chart, reusable and visible.
Search & filter
Browse, search, and filter by chart type across your whole library — find the chart you need in seconds.
Sharing at a glance
Each chart carries a 🔒 private / 👥 shared / 🌐 public badge so you always know exactly who can see it.
Reference, never copy
Pin one chart to many dashboards. Edit it once and every dashboard updates — no drift, no duplicates.
Start from a template
Kick off new charts from built-in templates instead of a blank canvas.
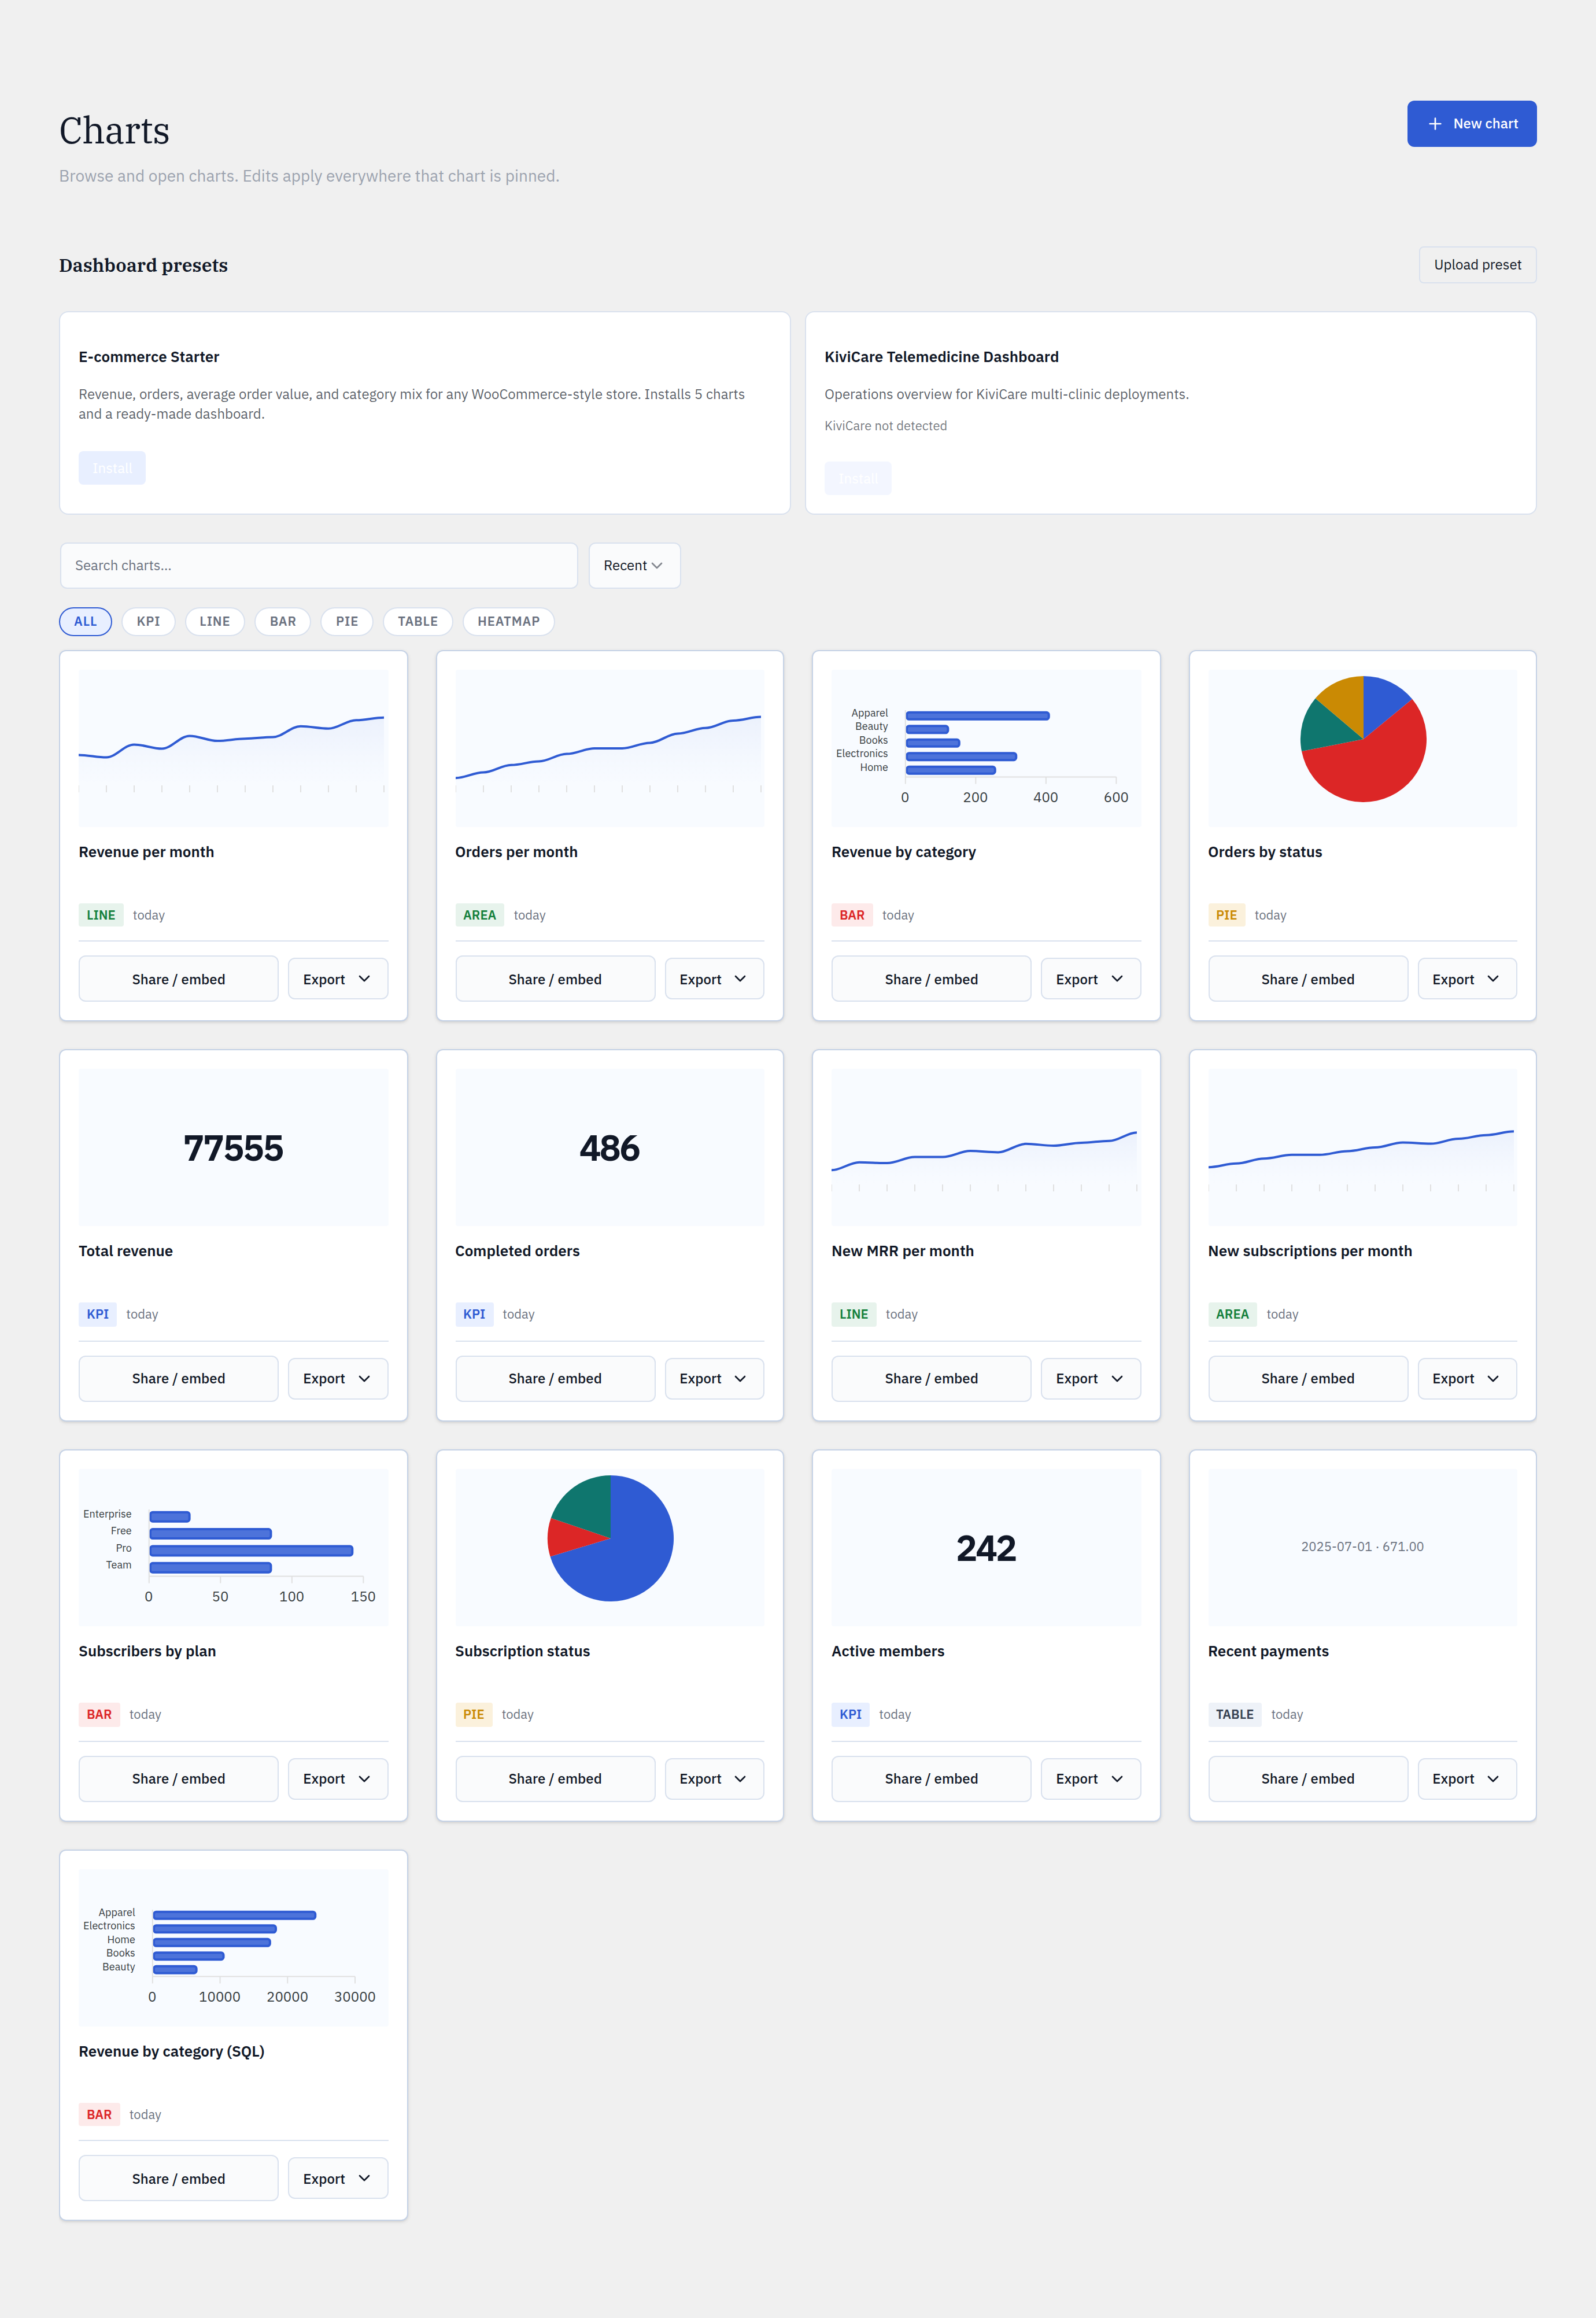
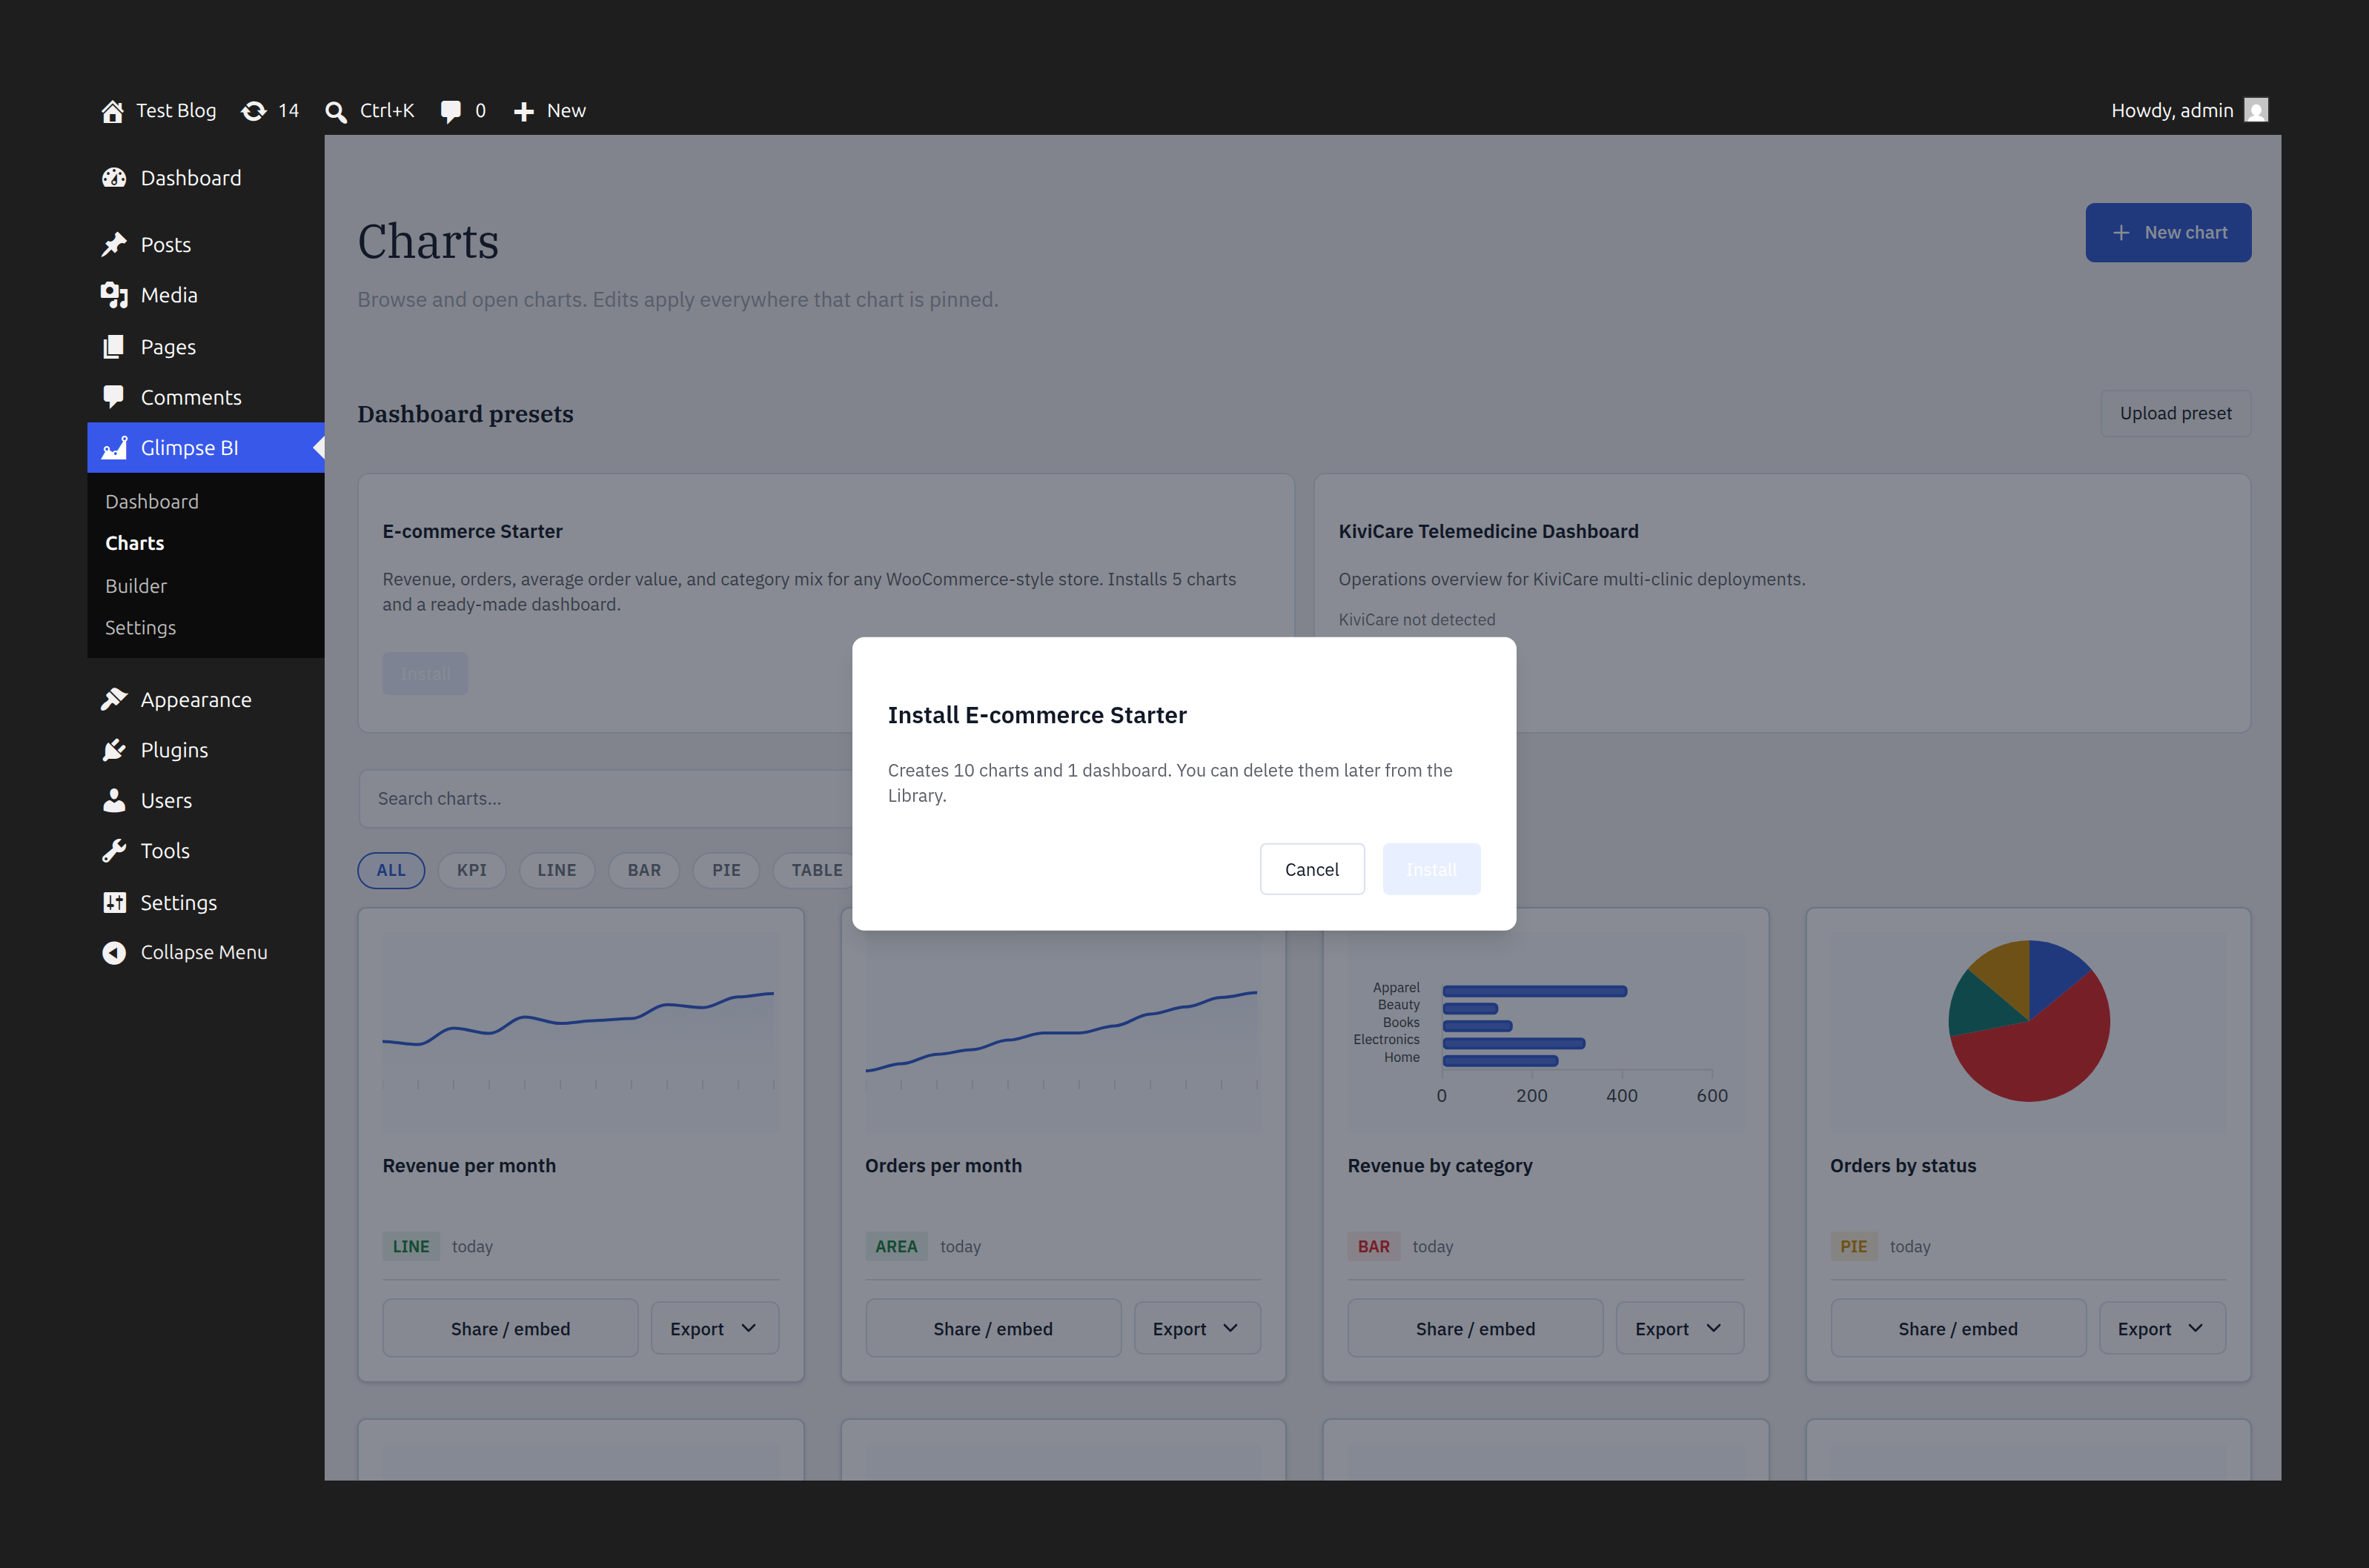
Presets
Install a whole dashboard in one click.
Pre-built dashboards
Install a complete, curated dashboard — like the KiviCare telemedicine pack — without building a single chart yourself.
Safe installs
Installing checks for required tables first and asks consent before touching your schema allowlist.
Upload & export
Package any dashboard as a shareable JSON preset, or import one — it round-trips to an identical dashboard.
Share & distribute
Get the data — and the charts — out.
Export, embed, and publish on your terms. Pro features are marked.
Data exports
Export any chart — or a whole dashboard — to CSV or JSON with injection-safe cells. XLSX (Excel) workbooks are a Pro upgrade. Large results run async.
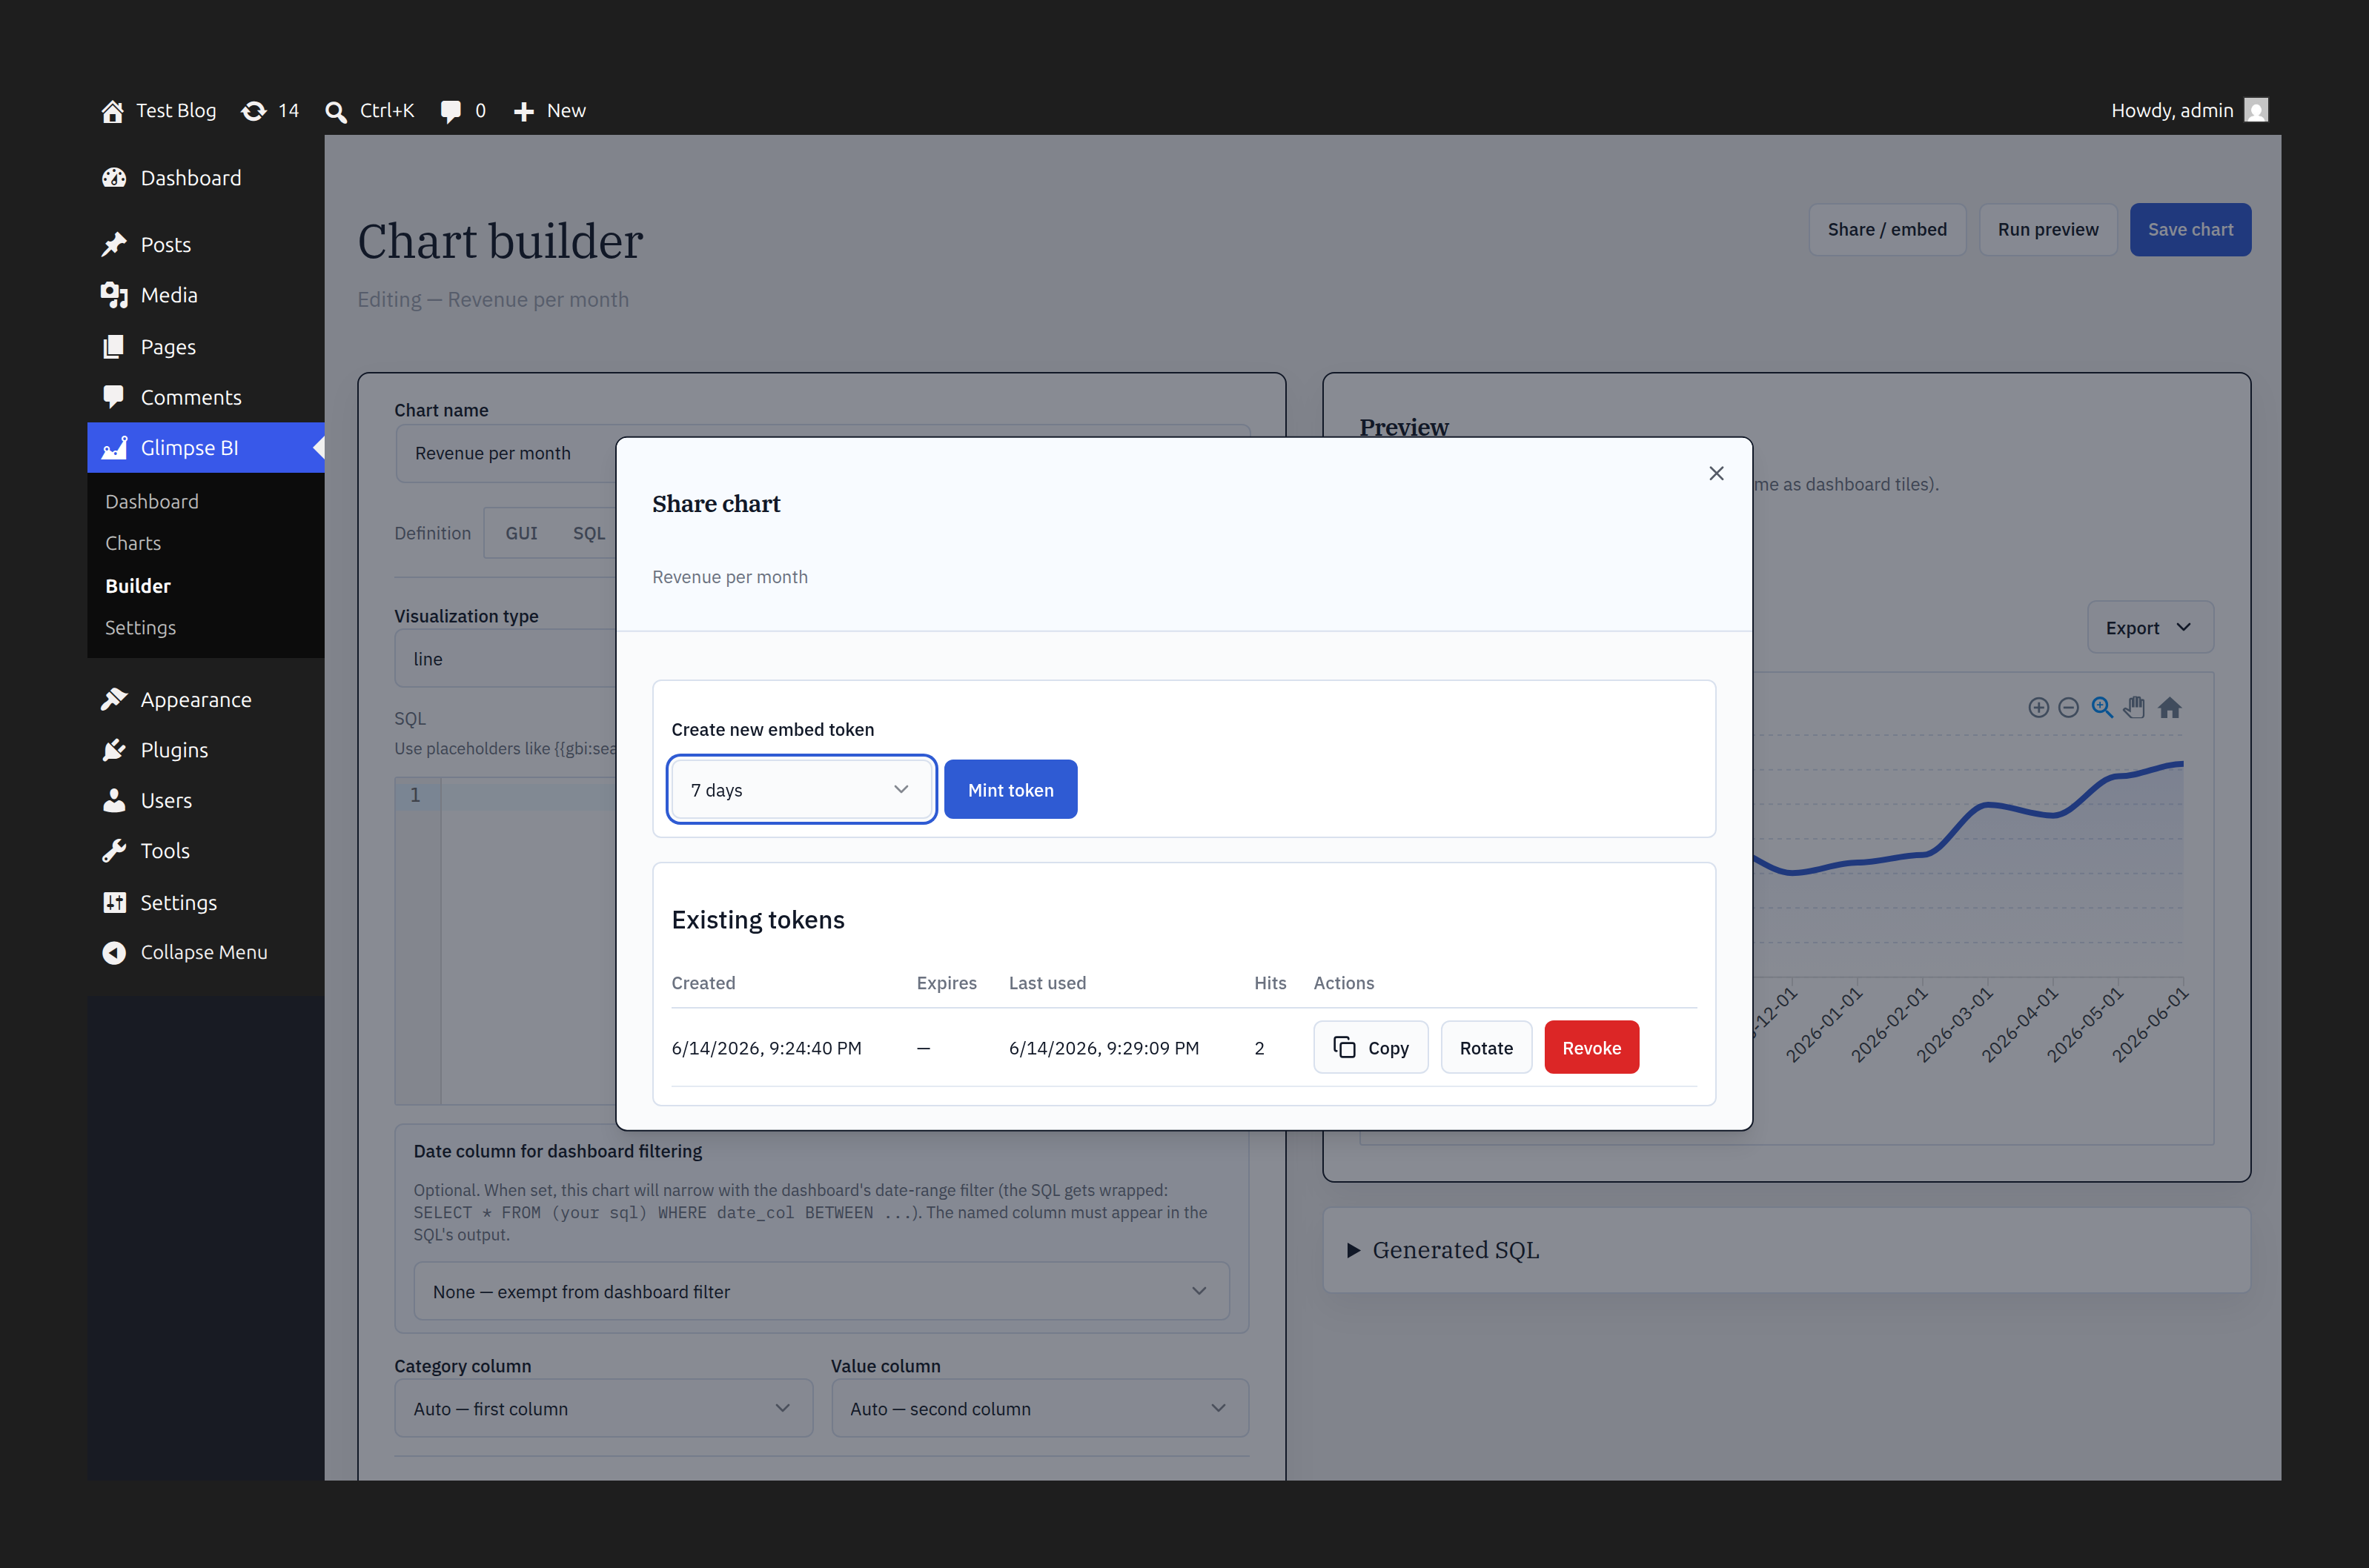
Public embeds
Publish a chart as a token-protected public iframe. Set expiry (24h / 7d / 30d / never), watch hit counts, and revoke or rotate a token anytime.
Front-end shortcodes
ProDrop a chart — or a full dashboard — into any post or page with a shortcode, no iframe required.
White-label
ProRemove the “Powered by Glimpse BI” watermark from embeds and add your own footer — ideal for agencies shipping to clients.
Whole-dashboard export bundles every chart. Large results run async.
Performance
Fast on small sites. Fast on huge ones.
Layered caching
Schema is cached for an hour; chart results flow through a stale-while-revalidate envelope so a slow query never blocks the page.
Parallel + stampede-safe
Dashboards load their charts in parallel, and a regeneration lock prevents thundering-herd cache misses.
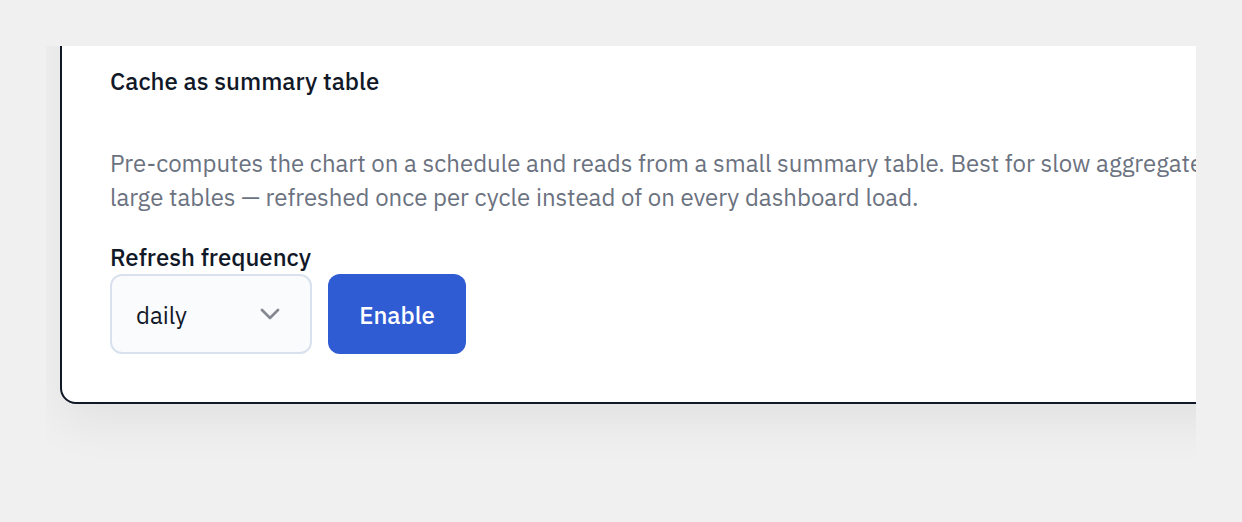
Materialization
ProPre-compute heavy charts into a summary table on an hourly, twice-daily, or daily schedule. Editing the chart safely reverts it to live mode.
Governance & security
Powerful for you, locked down for everyone else.
Read-only SQL, by AST
Every SQL query is parsed and validated at the AST level — SELECT and WITH … SELECT only. No writes, file access, sleeps, or multi-statements. All filter values are bound parameters.
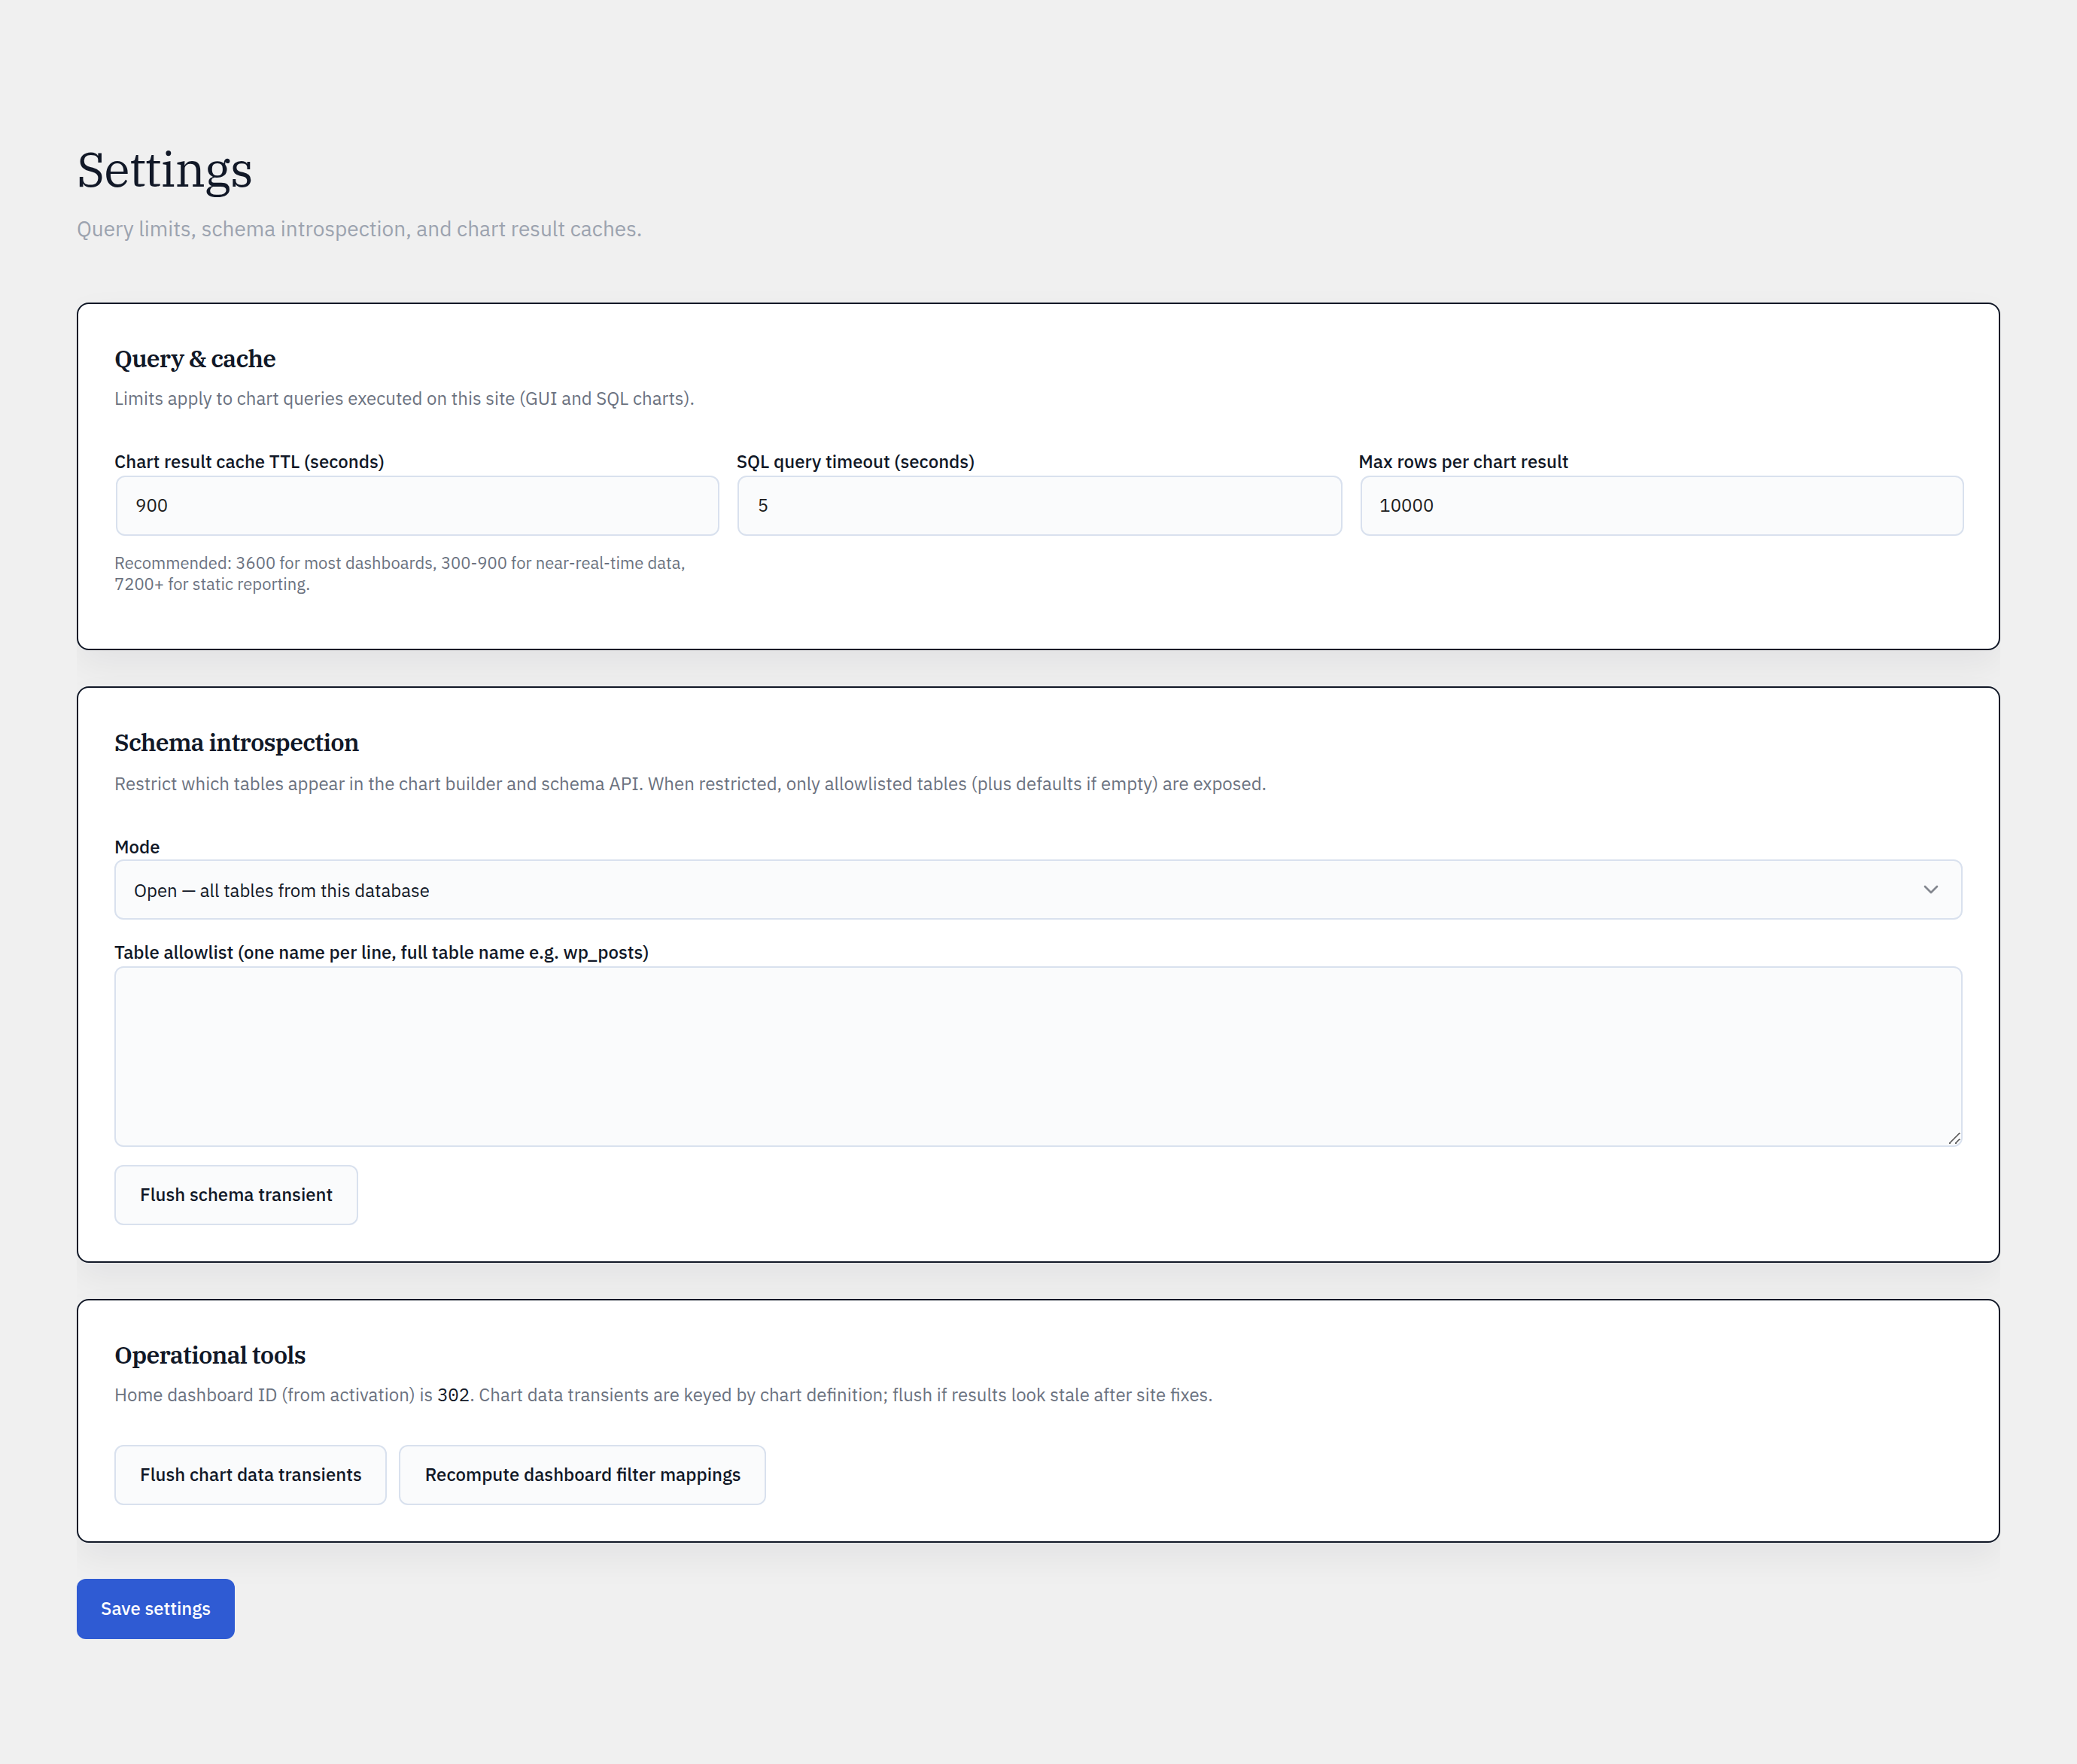
Schema allowlist mode
Show every table, or lock the GUI builder’s discovery to an admin-curated allowlist — core tables only by default.
Editor-role delegation
ProLet editors build their own charts and mint embed tokens — without access to SQL mode, settings, or other users’ assets.
Signed, rate-limited embeds
256-bit random tokens, per-token and per-IP rate limits, and configurable expiry keep public charts safe to share.
Pro marks a feature that requires the Pro plugin.
See it in your own wp-admin.
Install the free plugin and build your first chart from your real data in minutes.