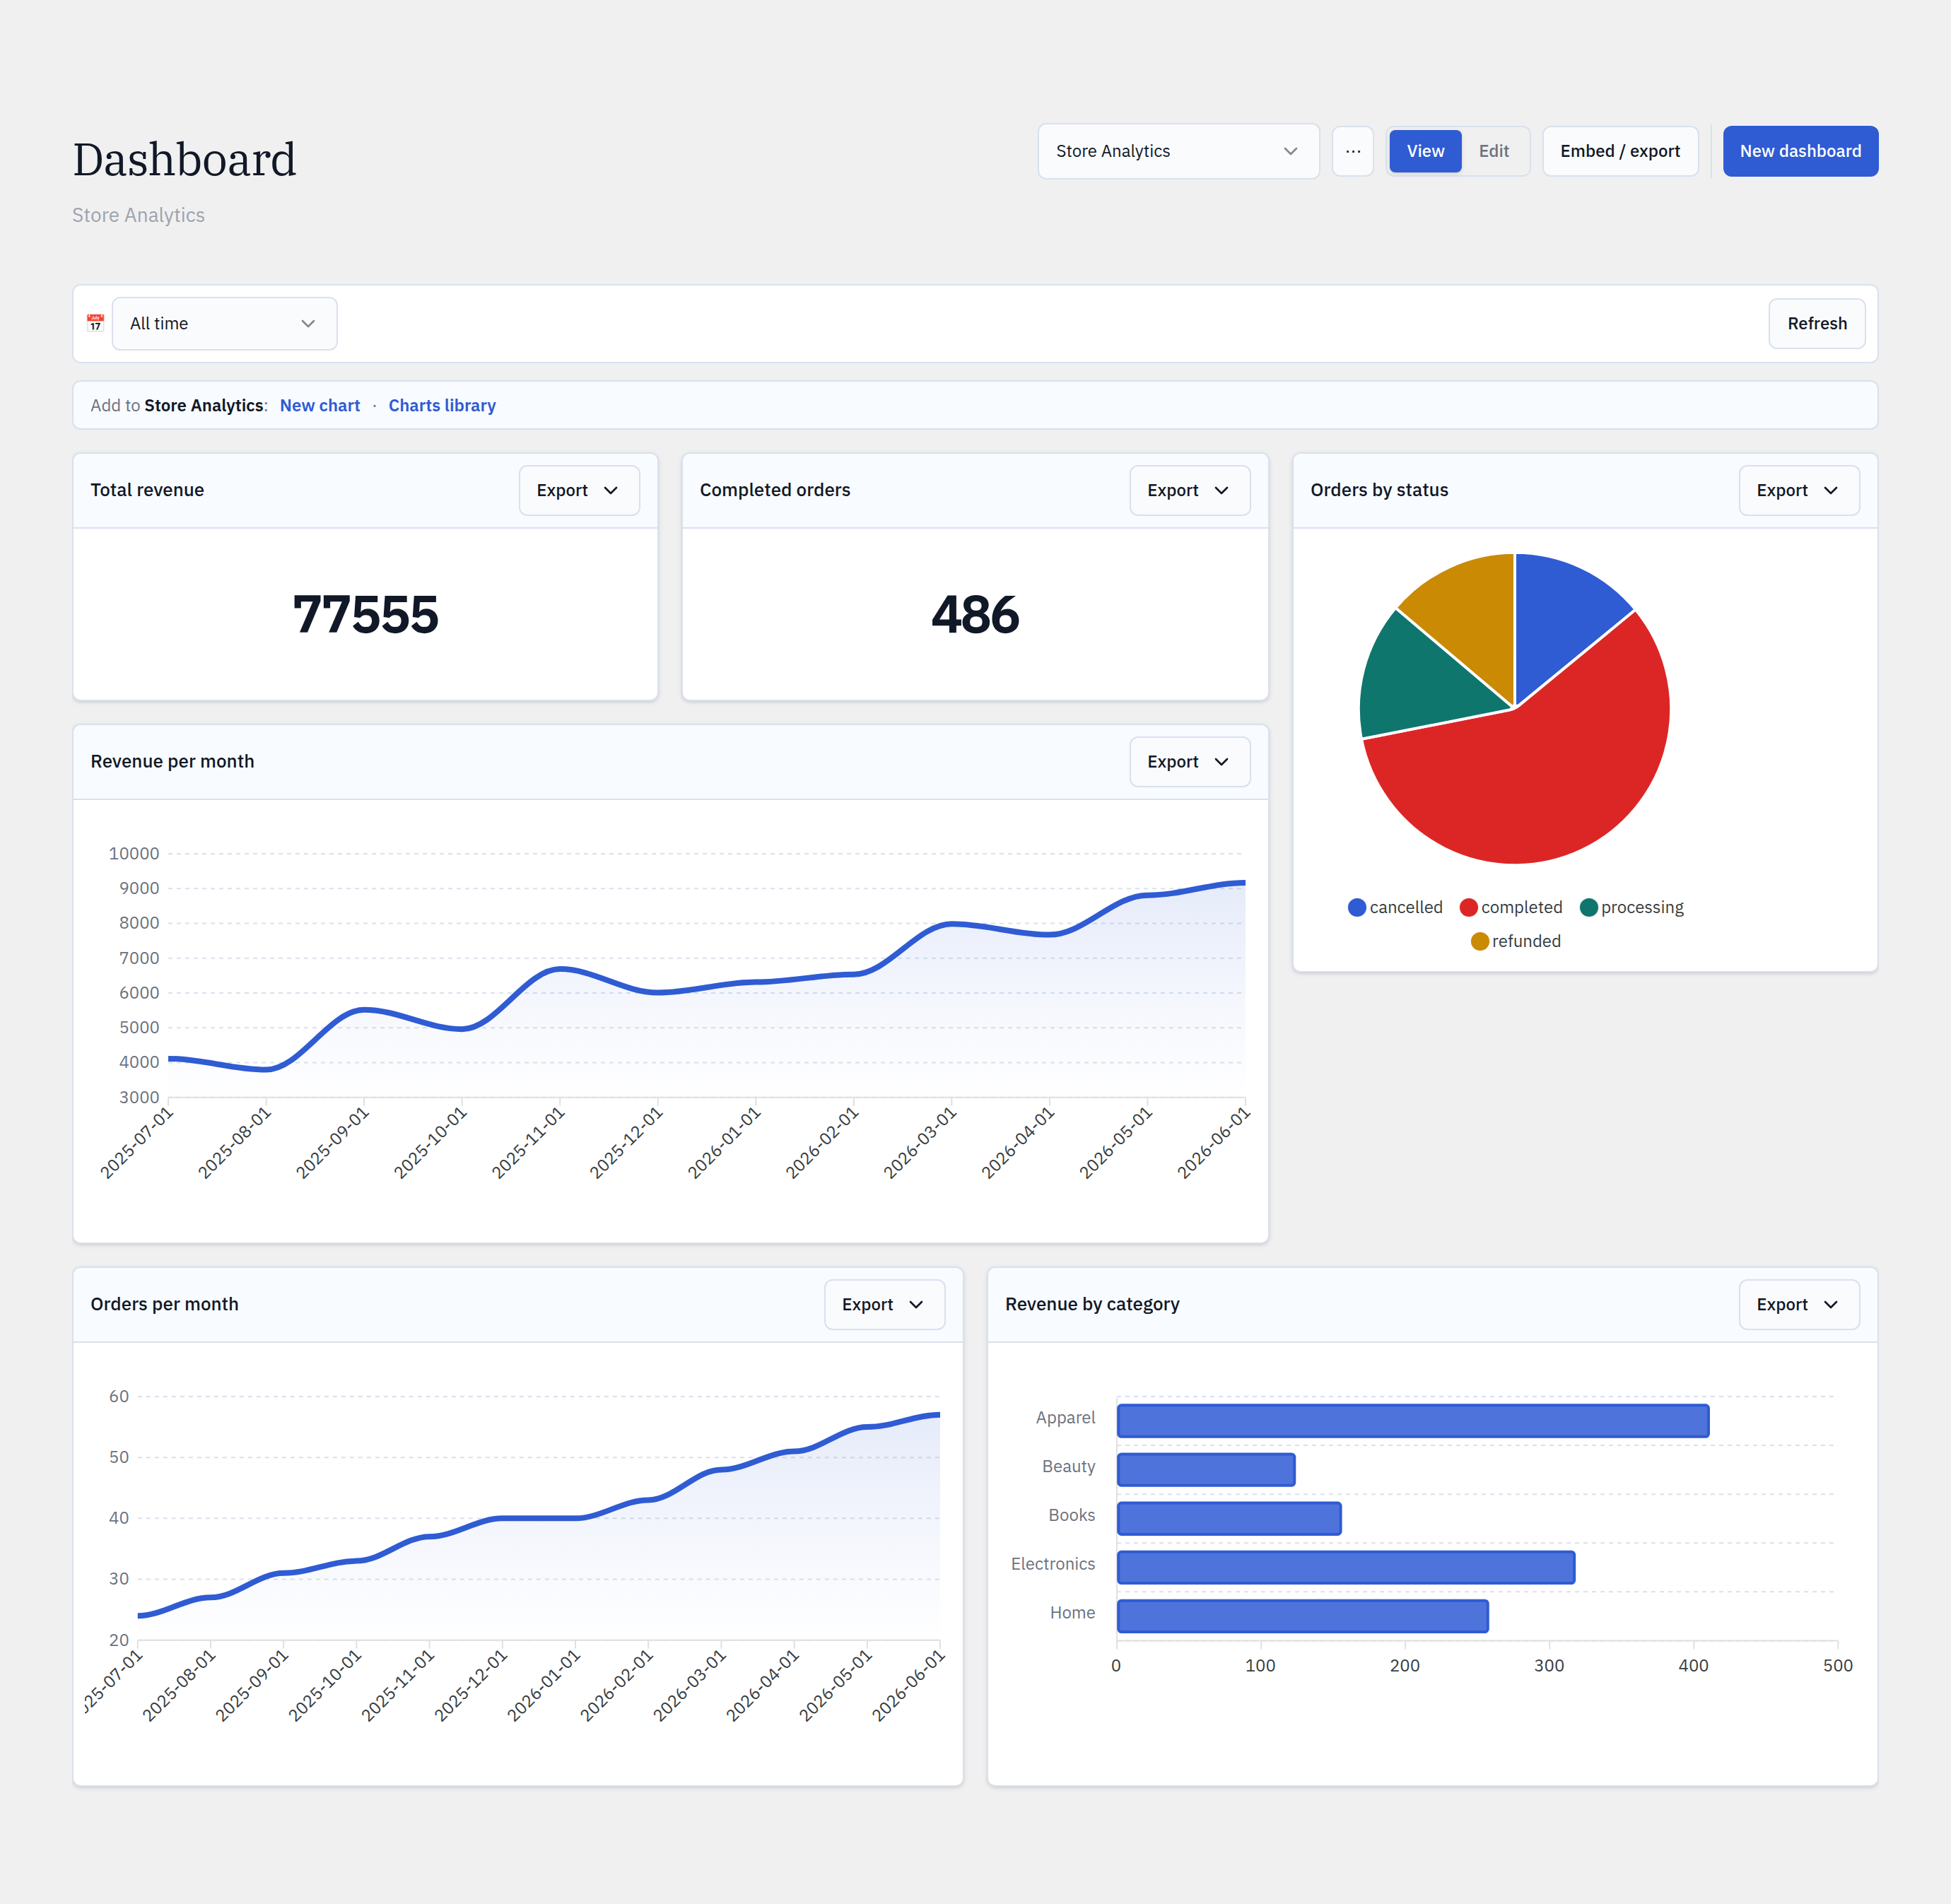
Charts & Dashboards for WordPress
A small, opinionated that lives inside wp-admin.
Build charts from any table in your WordPress database — with a no-code builder or raw SQL — arrange them on drag-drop dashboards, and embed them anywhere. No separate stack, no data leaving your server.
Free on WordPress.org · GUI + SQL · 7 chart types
One product, three people
From point-and-click to raw SQL — and out to the world.
Glimpse BI serves the non-technical owner and the analyst in the same install, then publishes the result to anyone.
No SQL, no setup
Pick a table, choose Count / Sum / Average, drop in a dimension. Glimpse BI introspects every table in your database and surfaces join shortcuts, with a live preview as you go.
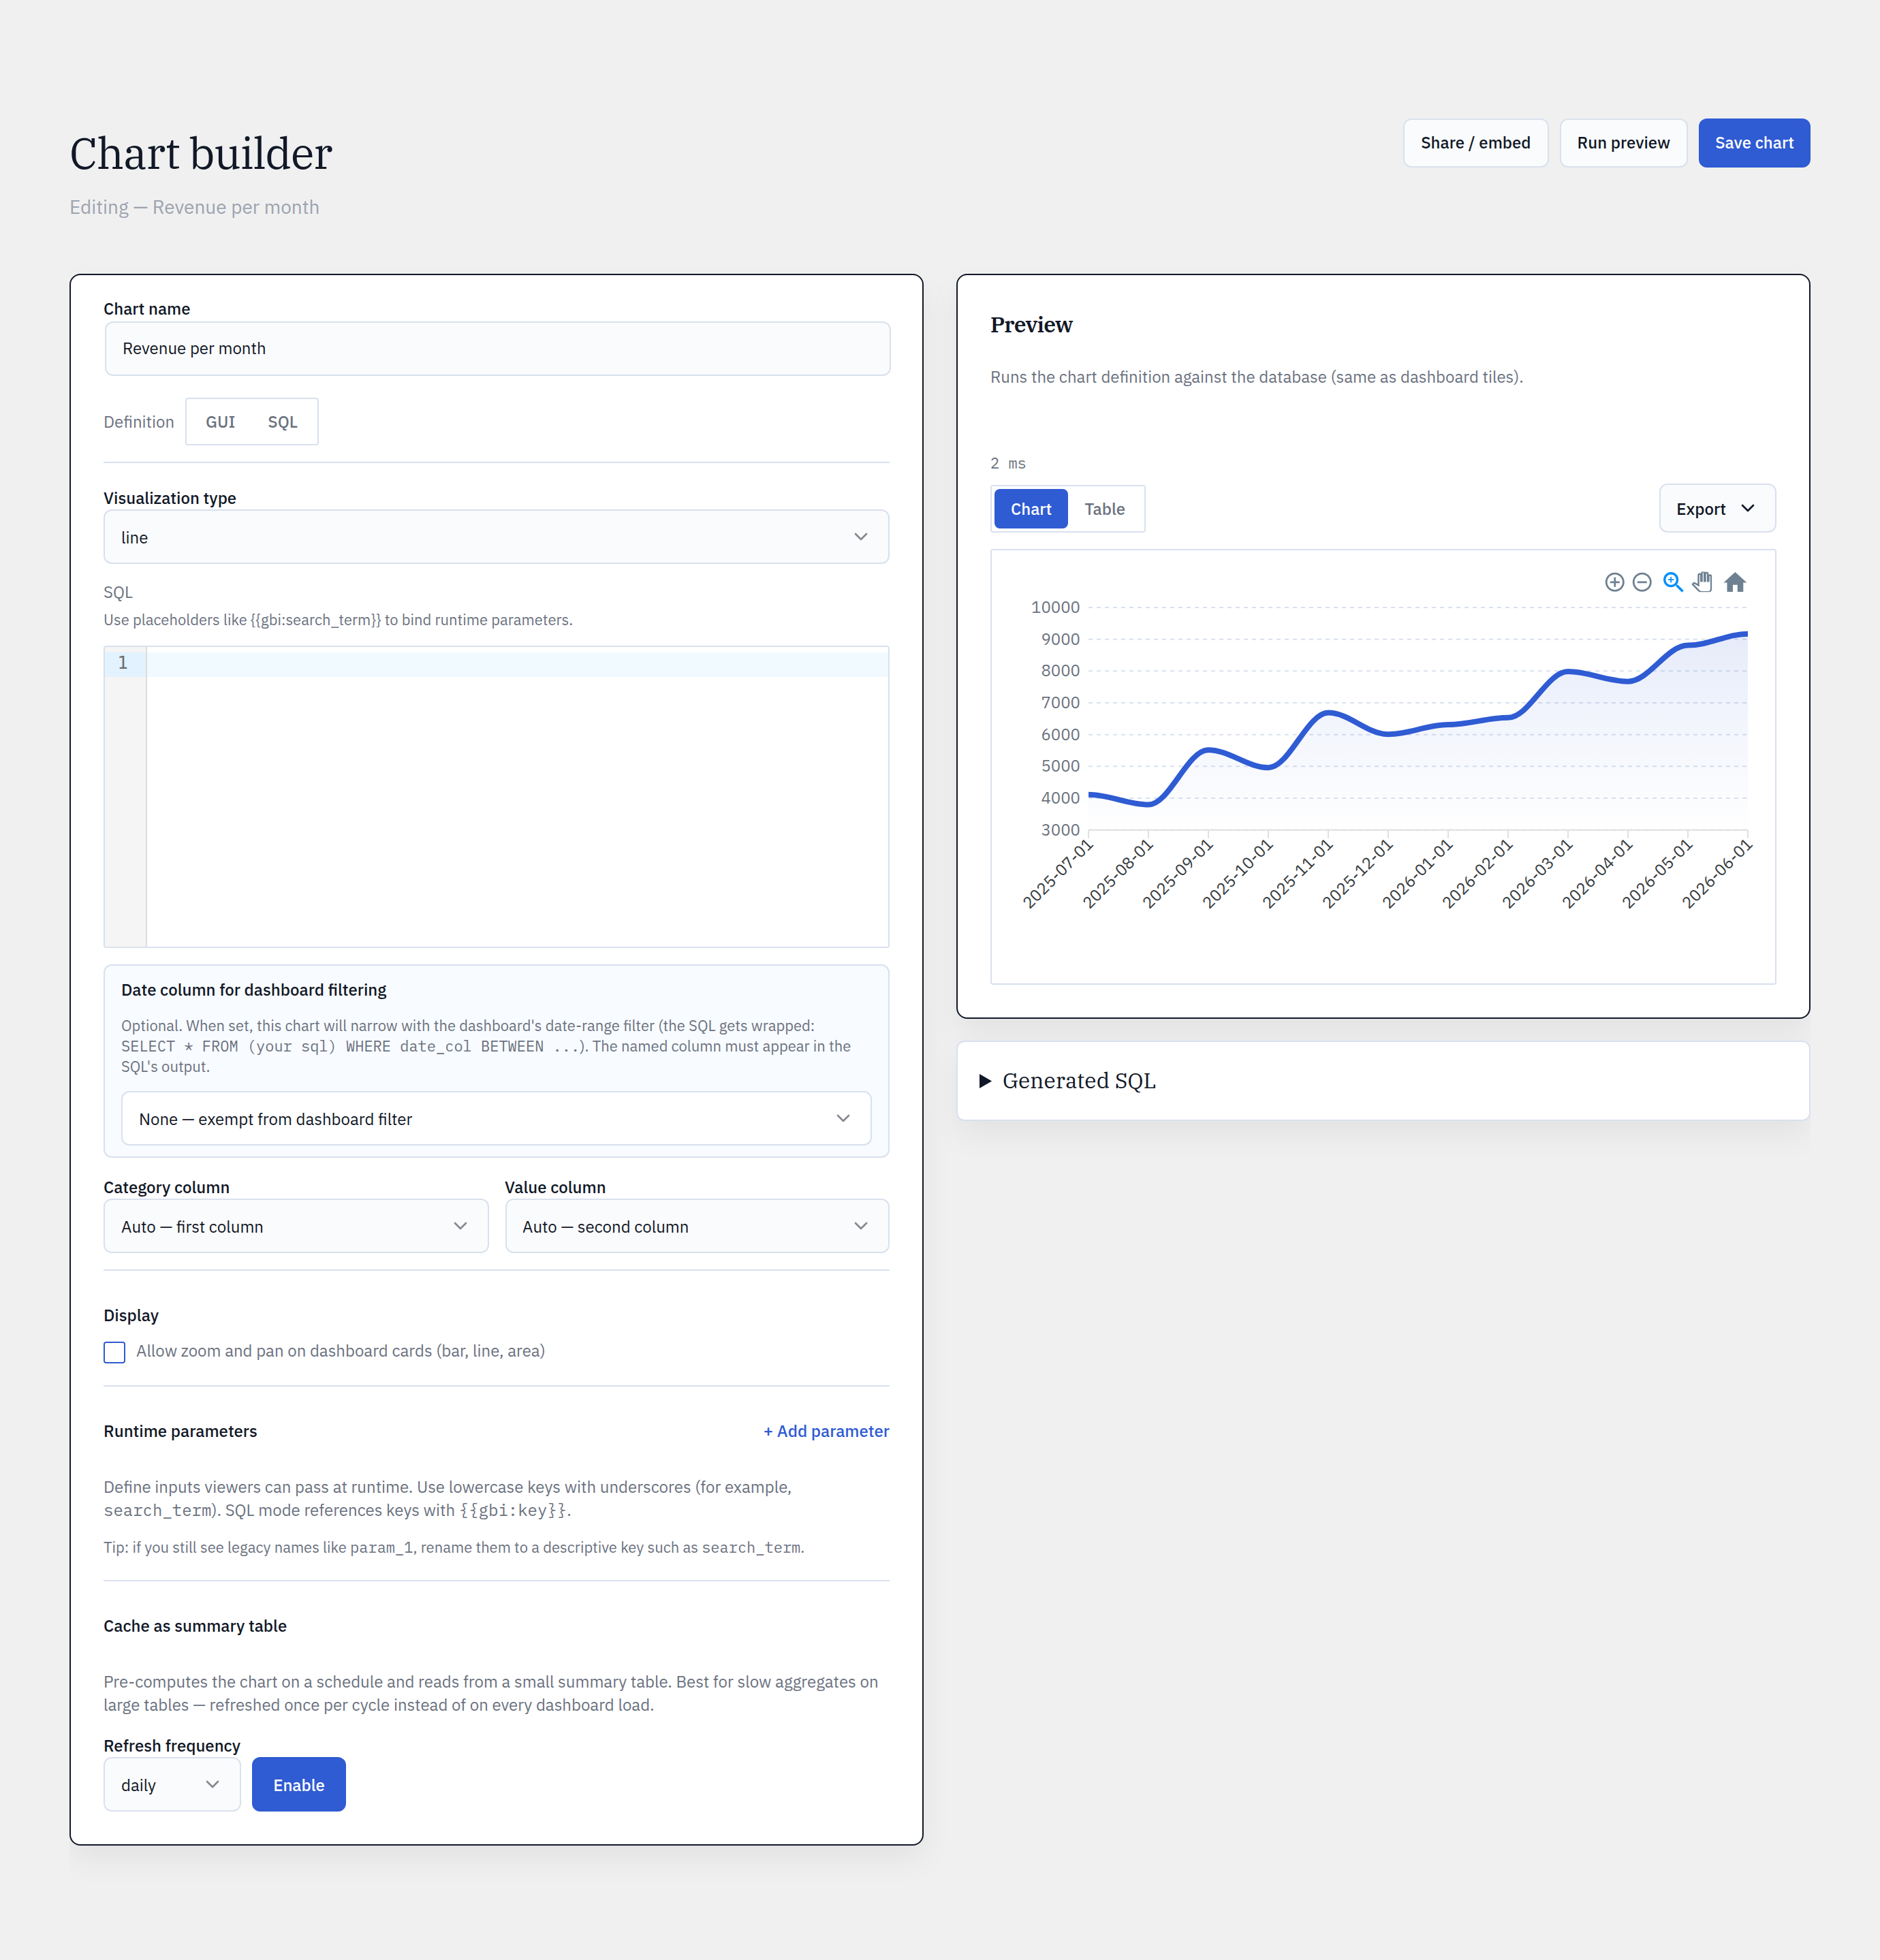
Full power, still safe
When the GUI runs out of room, switch to a CodeMirror SQL editor. Queries are validated read-only at the AST level — never a regex, never a write — with runtime parameters bound from dashboard filters.
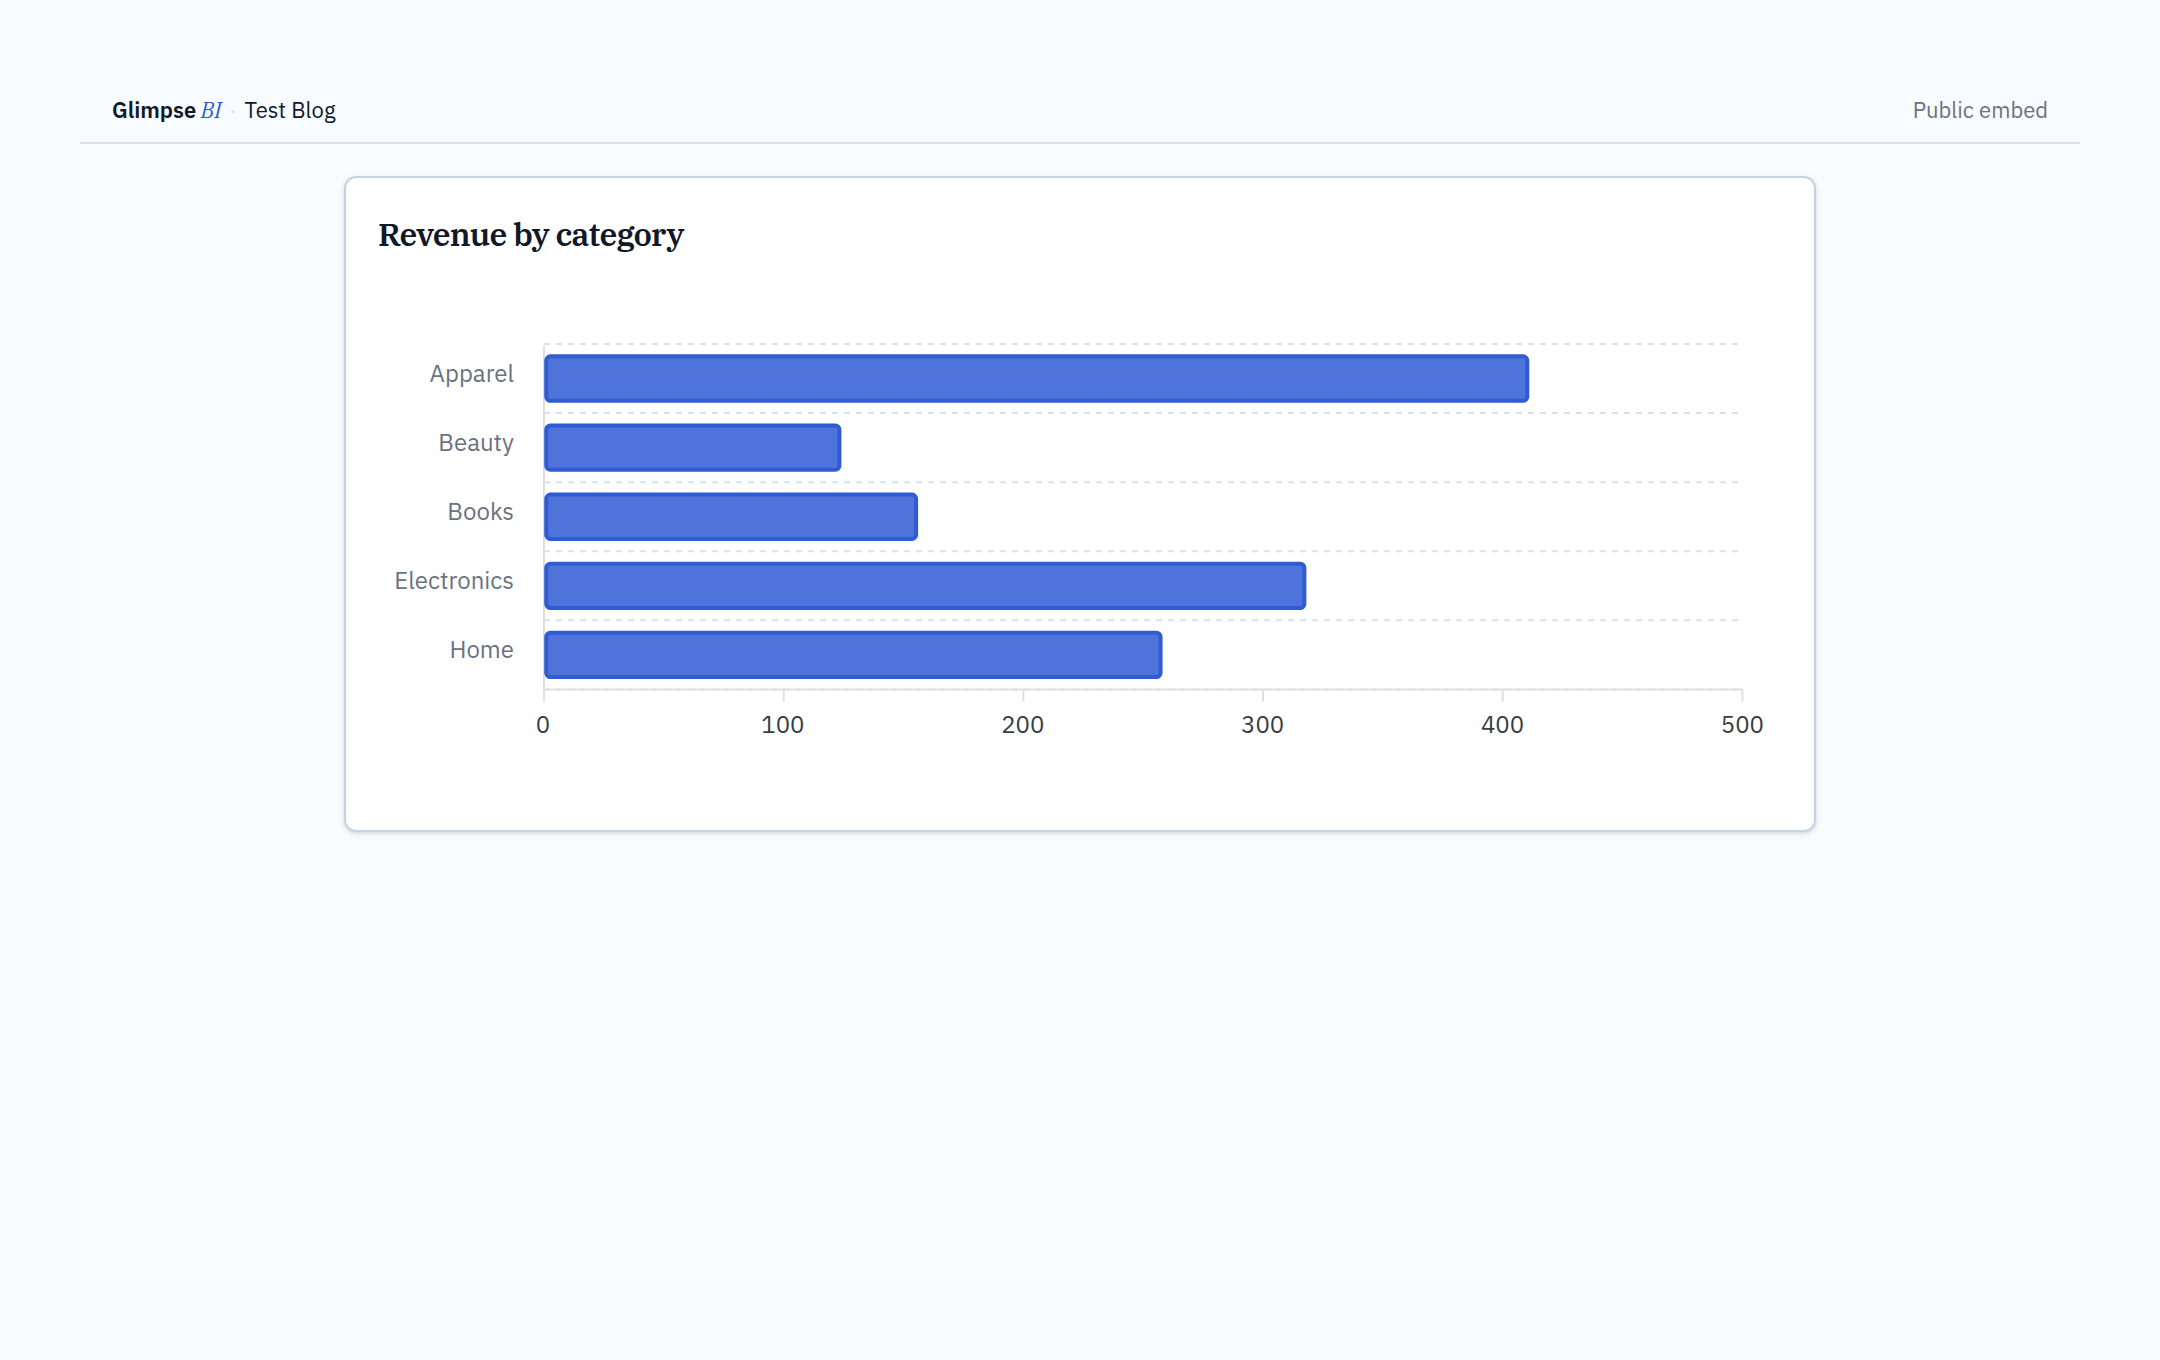
Publish anywhere
Publish any chart as a token-protected public embed — drop it on your About page or hand it to a client. No WordPress account required to view, with expiry and revoke controls you keep.
Why Glimpse BI
The power of a BI tool, without the baggage.
Your data never leaves the server
Unlike Jetpack Stats or MonsterInsights, nothing is exfiltrated to a third-party service. Charts are computed from your local database and rendered in place.
No separate stack to run
Metabase, Looker and Power BI need their own infrastructure and expose your database to the network. Glimpse BI lives in the wp-admin you already trust.
Native WordPress access control
Capability checks, nonces, and signed embed tokens. Permissions you already manage in WordPress — no second auth system to wire up.
GUI for editors, SQL for developers
One product serves the non-technical owner and the analyst. The GUI greys out gracefully when a SQL chart outgrows it — no broken round-trips.
Seven ways to see it
Every chart type you need to read your data.
KPI tiles, time series, distributions, heatmaps and tables — all themed with one editorial design system.
One-click presets
Skip the setup. Install a whole dashboard.
Pre-built, curated dashboards install in one click — no chart-building required. Upload your own to share across sites.
KiviCare Telemedicine
5 KPIs · 5 detail tables · multi-clinic
WooCommerce Sales
Revenue, orders, top products
Editorial Overview
Publishing cadence, categories, engagement
The KiviCare telemedicine pack is the flagship — see the full story →
Free to start
Generous free tier. Pro when you grow.
The free plugin is the full v1.x product with sensible caps. When you hit them, Pro lifts every limit and adds materialization, white-label embeds, and more.
Bring your WordPress data into focus.
Install the free plugin and build your first chart in minutes. Upgrade to Pro when you outgrow the caps.