← Docs
Documentation
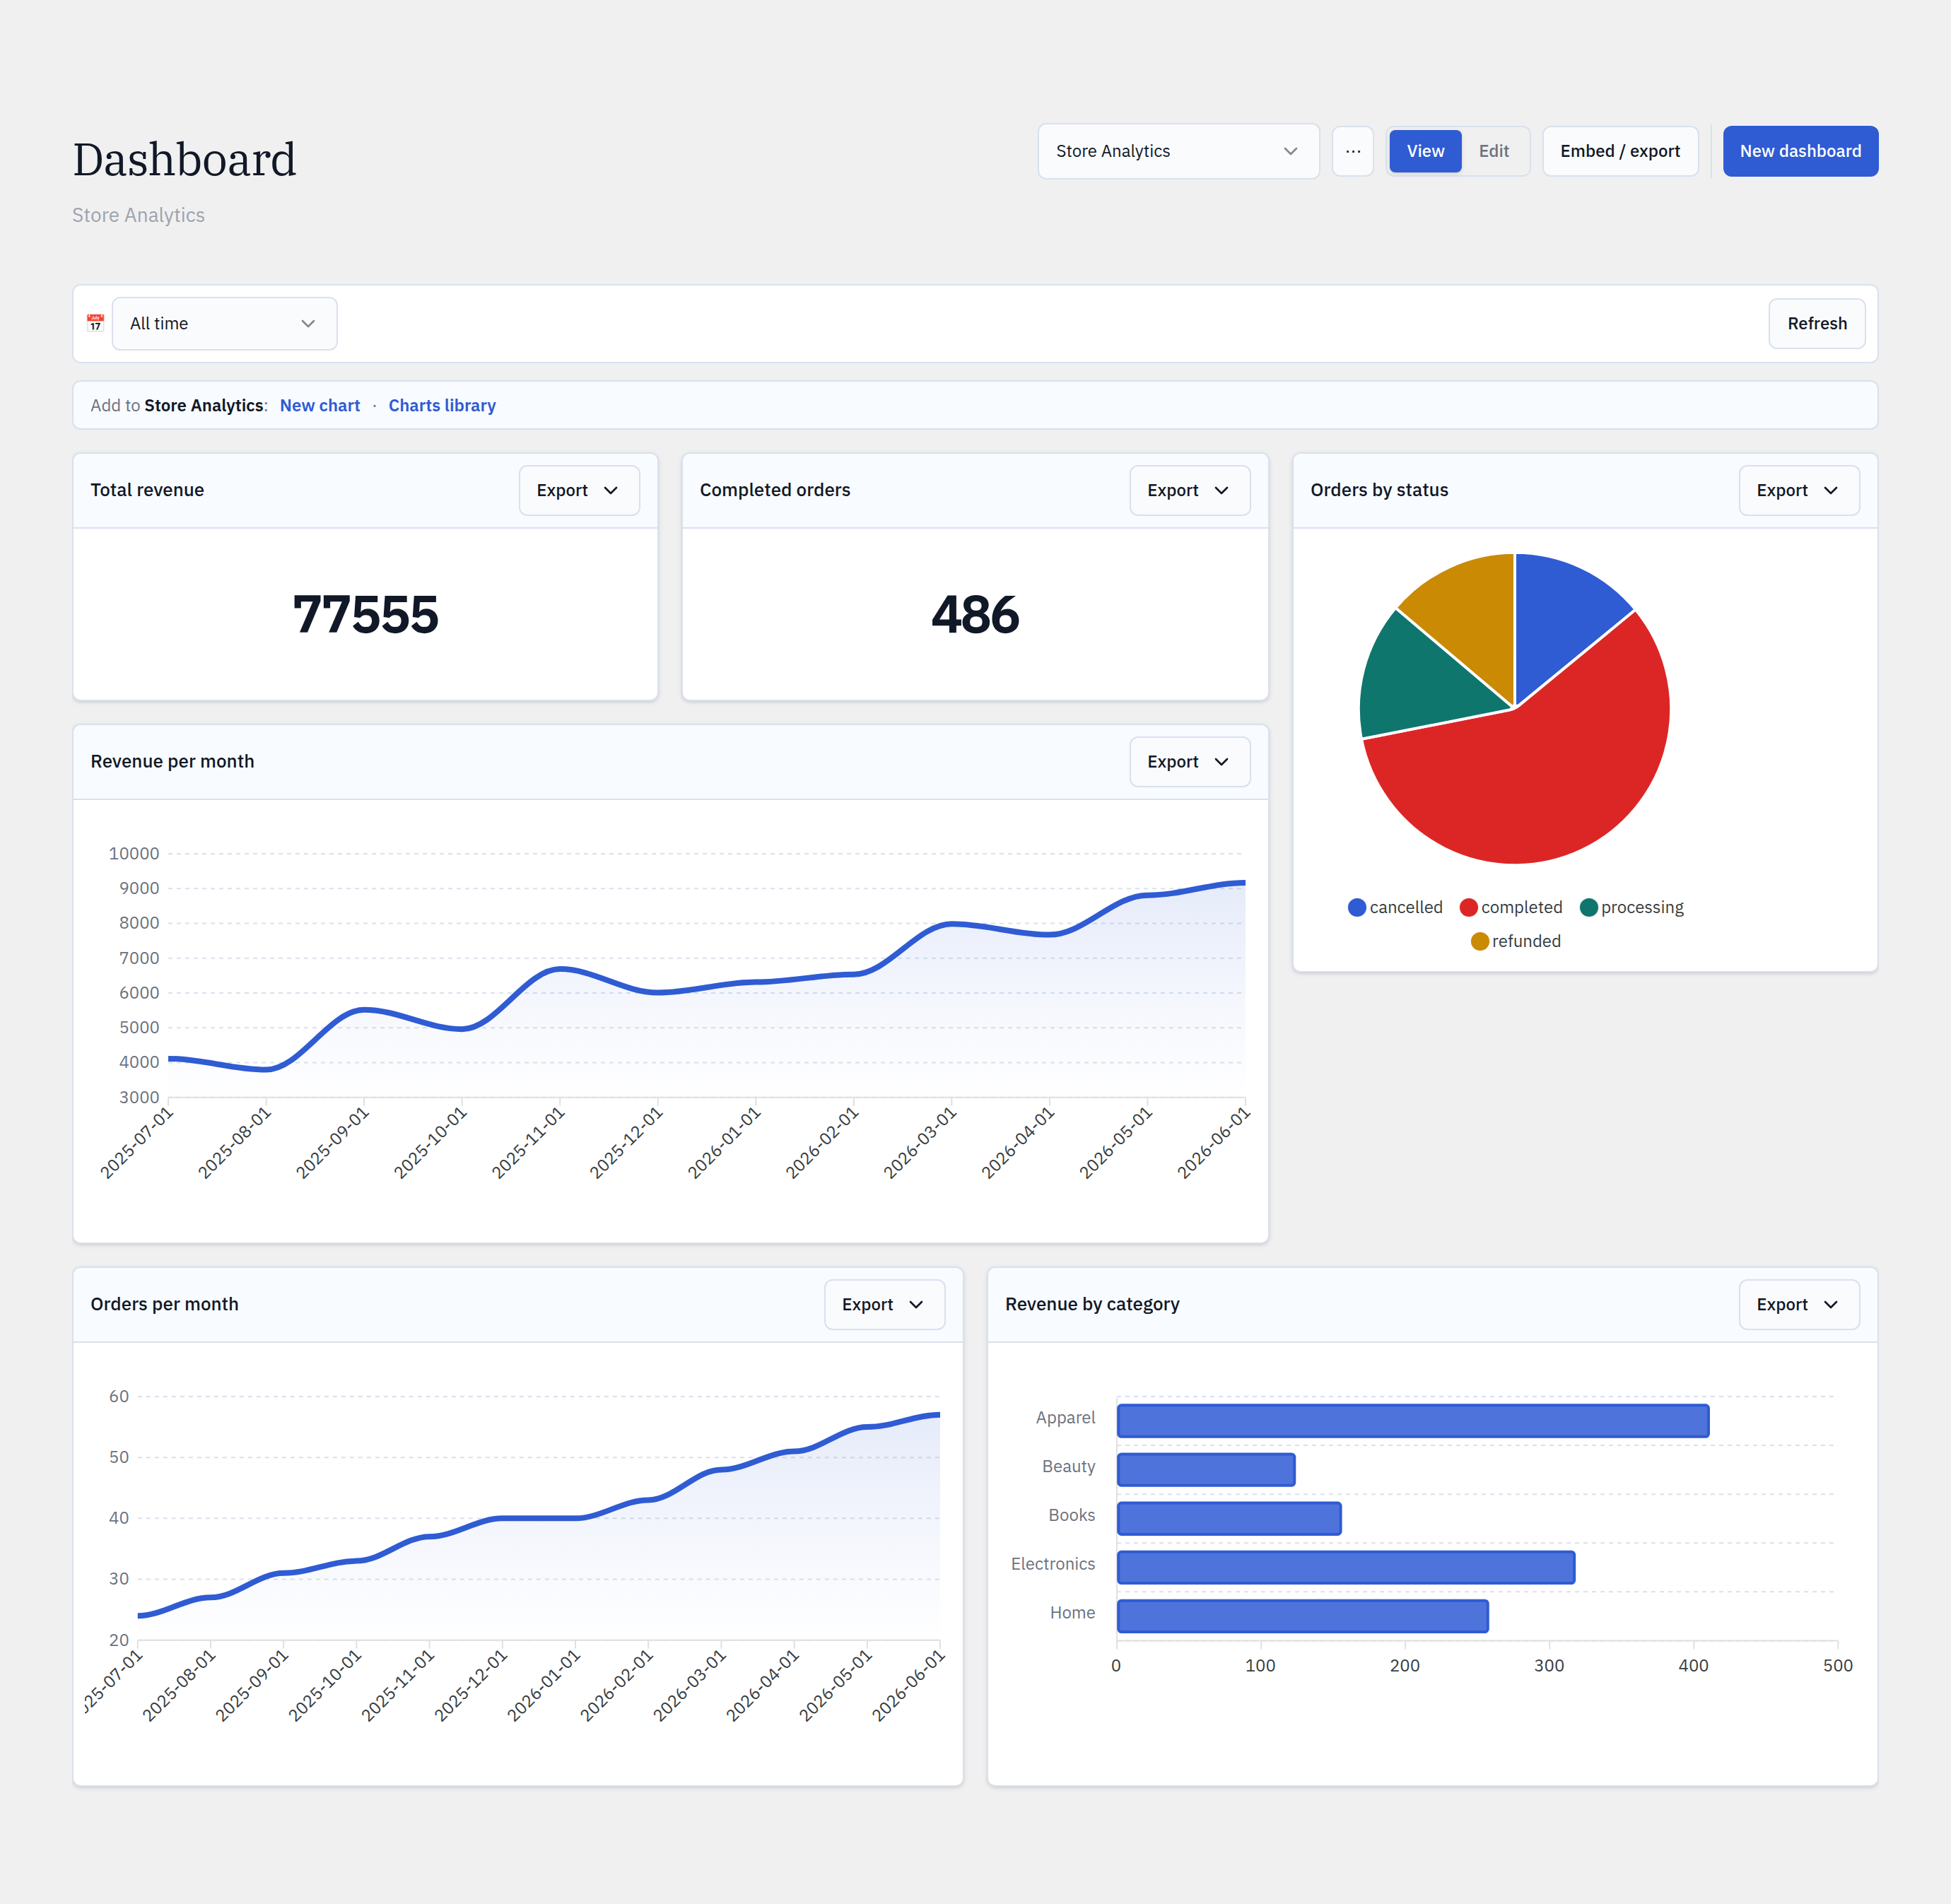
Dashboards
Arrange charts on a responsive 12-column grid. Drag to reposition, drag a corner to resize, and pin the same chart to as many dashboards as you need.
Step by step
- 1Open Glimpse BI → Dashboard. The Home dashboard is selected by default.
- 2Click Edit to enter edit mode — resize handles appear on every tile.
- 3Drag a tile by its header to move it; drag the bottom-right handle to resize.
- 4Use “Add charts” to pin existing charts onto the grid.
- 5Switch dashboards, or create a new one, from the selector in the toolbar.
- 6Use Embed / export to share the whole dashboard or download its data.
yoursite.com/wp-admin/admin.php?page=glimpsebi-dashboard
The grid
Dashboards use a 12-column react-grid-layout that reflows responsively. Tile positions are stored as a layout (chart_id + x/y/w/h) in post meta — the charts themselves live separately and are only referenced.
The Home dashboard
One dashboard is marked Home and is shown when you open the Dashboard screen with no specific dashboard selected. It’s protected from deletion so there’s always a landing view.
Reference
Grid12 columns, responsive
Layout storageJSON in post meta (_glimpsebi_layout)
ChartsReferenced by ID, never copied
Free cap1 dashboard (Pro: unlimited)
Home dashboardProtected from deletion
Bring your WordPress data into focus.
Install the free plugin and build your first chart in minutes. Upgrade to Pro when you outgrow the caps.