Documentation
Schema & data sources
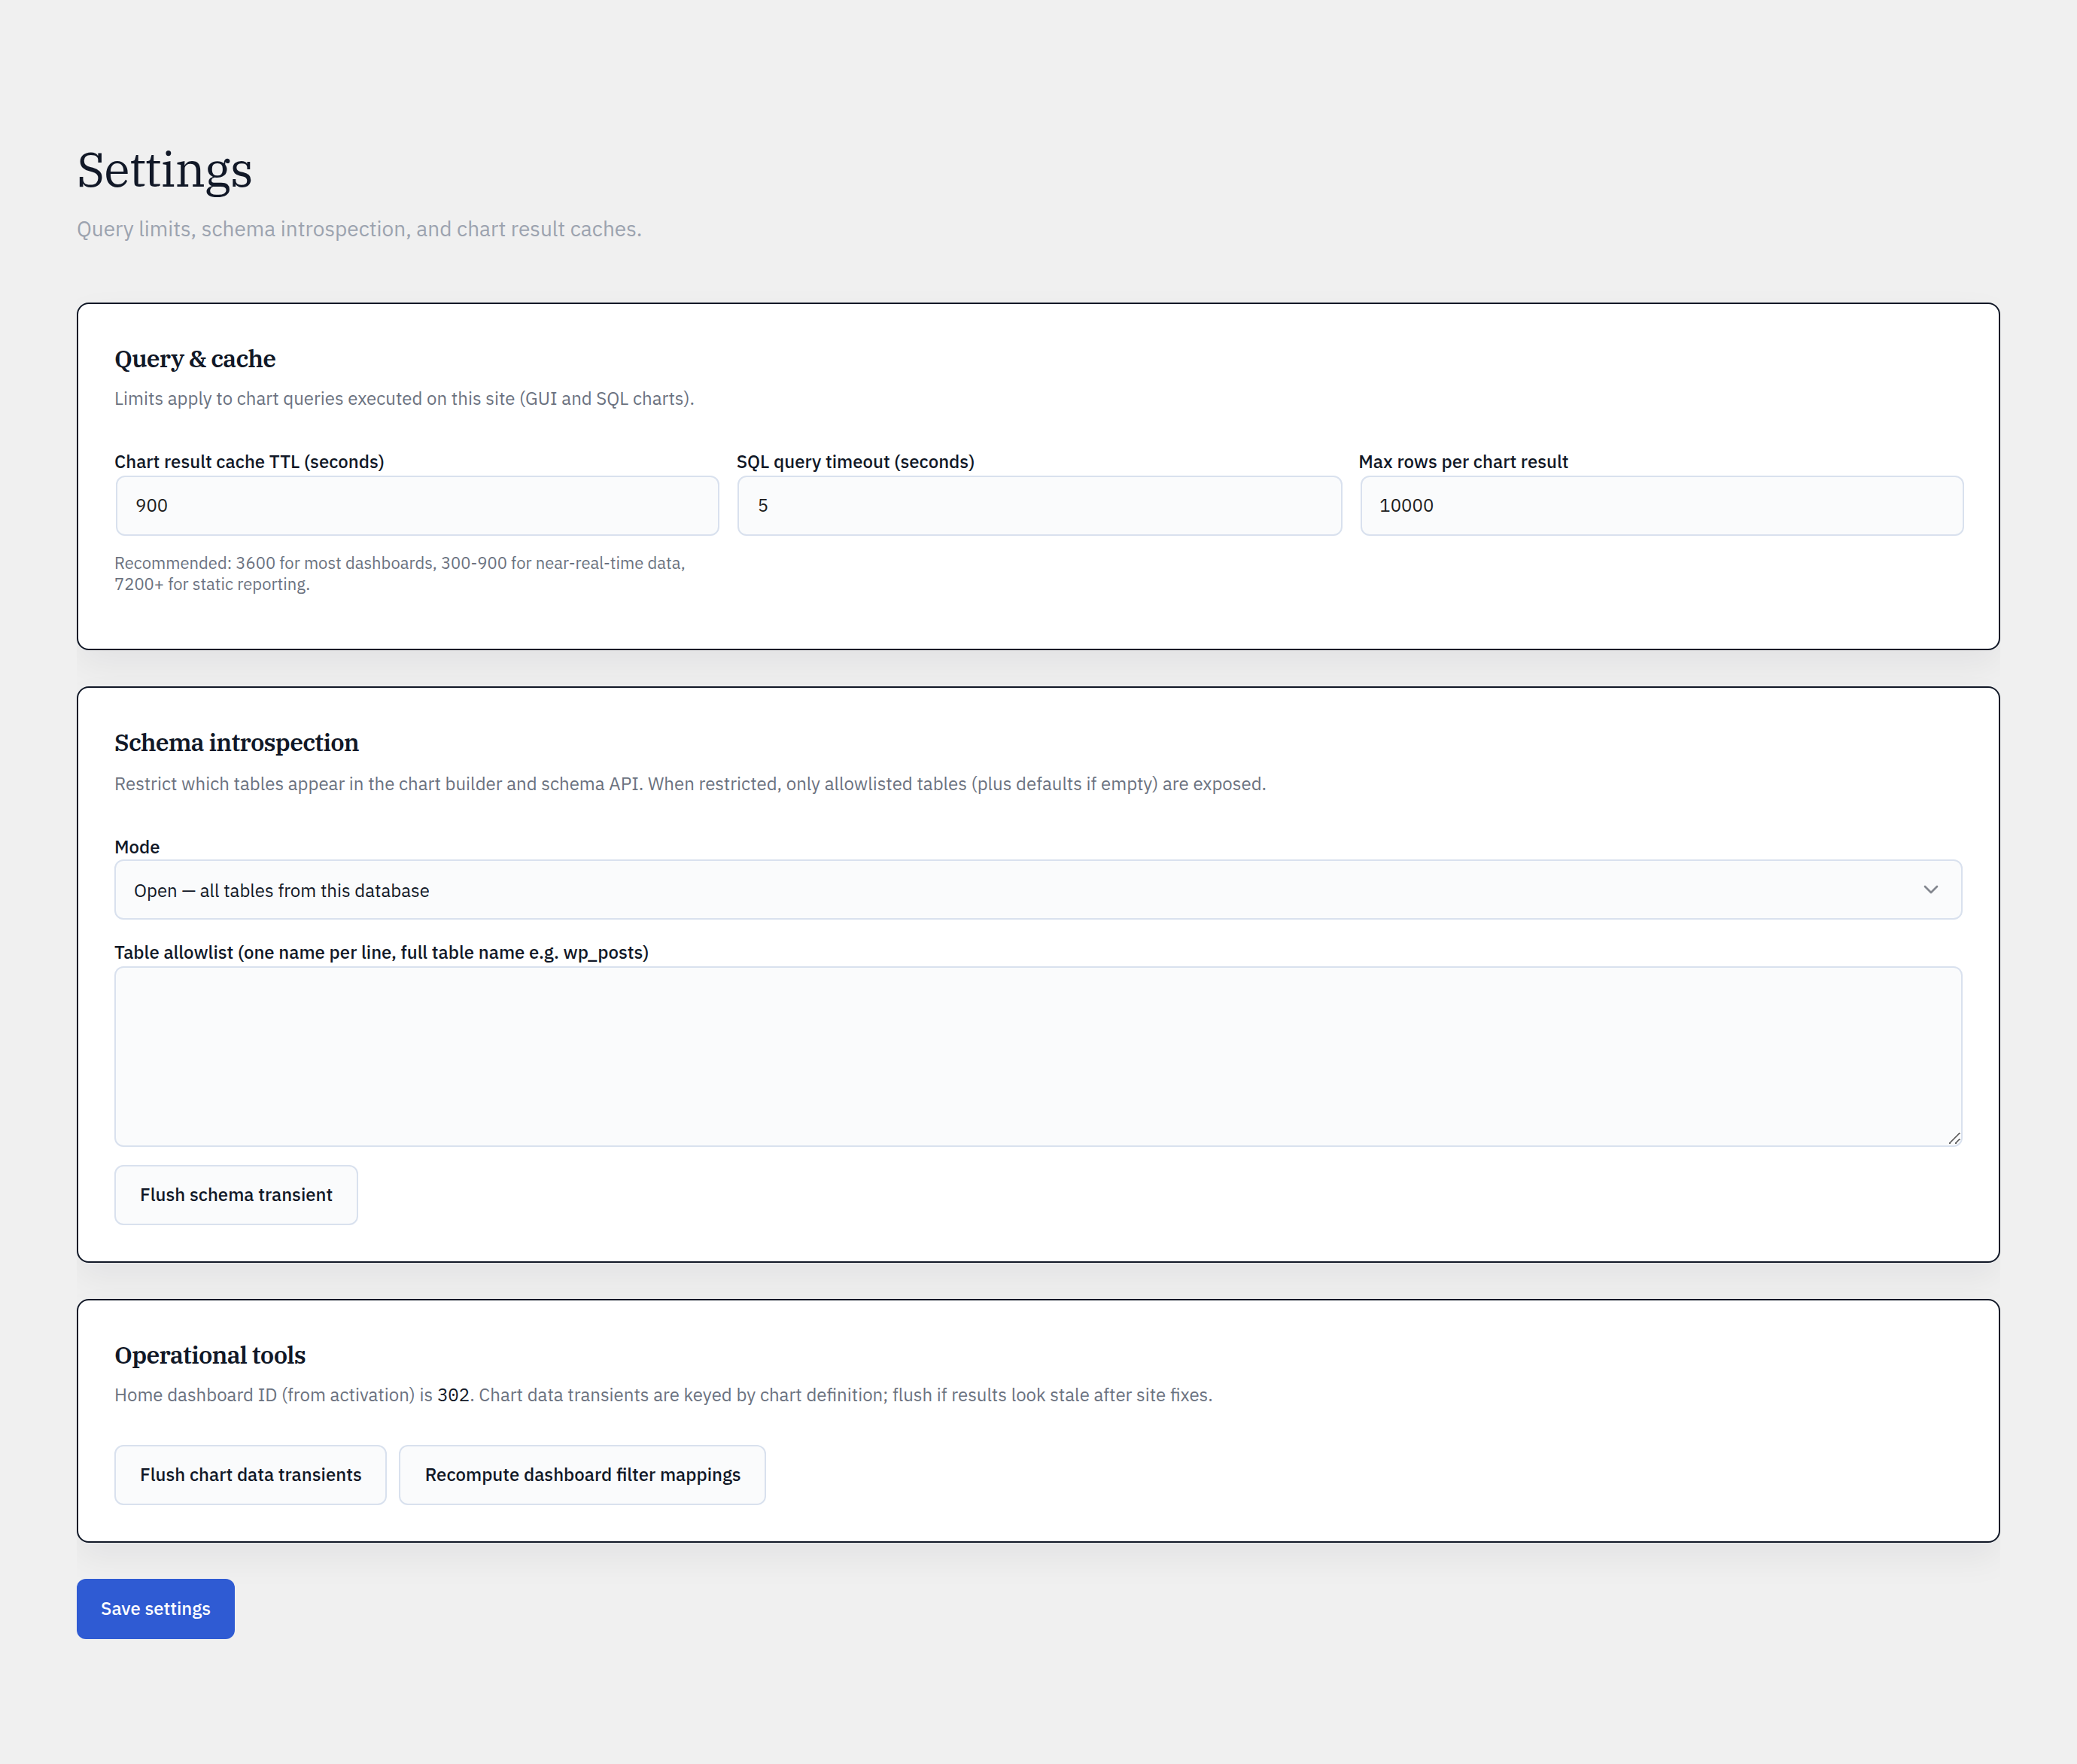
Glimpse BI introspects your database and lists tables in the builder. A schema mode and allowlist control exactly which tables are chartable.
Step by step
- 1Open Glimpse BI → Settings → Schema.
- 2Choose a schema mode: Open (all tables) or Allowlist (only listed tables).
- 3In Allowlist mode, list the tables you want chartable (one per line, with your table prefix).
- 4Save. The builder’s Source-table list updates to match.
- 5Use Refresh schema if you add tables and they don’t appear yet (introspection is cached for an hour).
What’s discoverable
Introspection reads table and column names from the database’s information schema. By default the core WordPress tables (posts, users, comments, terms) are surfaced; switch to Open to chart any table, or Allowlist to restrict to a curated set — useful on shared installs.
Joins
GUI charts are single-table for safety and clarity. To combine tables, use SQL mode and write the JOIN yourself — it passes the same read-only AST validator. (A revenue-by-category chart, for example, joins orders → order-items → products in SQL mode.)
Reference
Bring your WordPress data into focus.
Install the free plugin and build your first chart in minutes. Upgrade to Pro when you outgrow the caps.