Documentation
ProMaterialization
A Pro feature that pre-computes a chart’s results into a dedicated summary table on a schedule — turning slow queries on large databases into instant dashboard loads.
Step by step
- 1Open a chart in Glimpse BI → Builder (GUI mode).
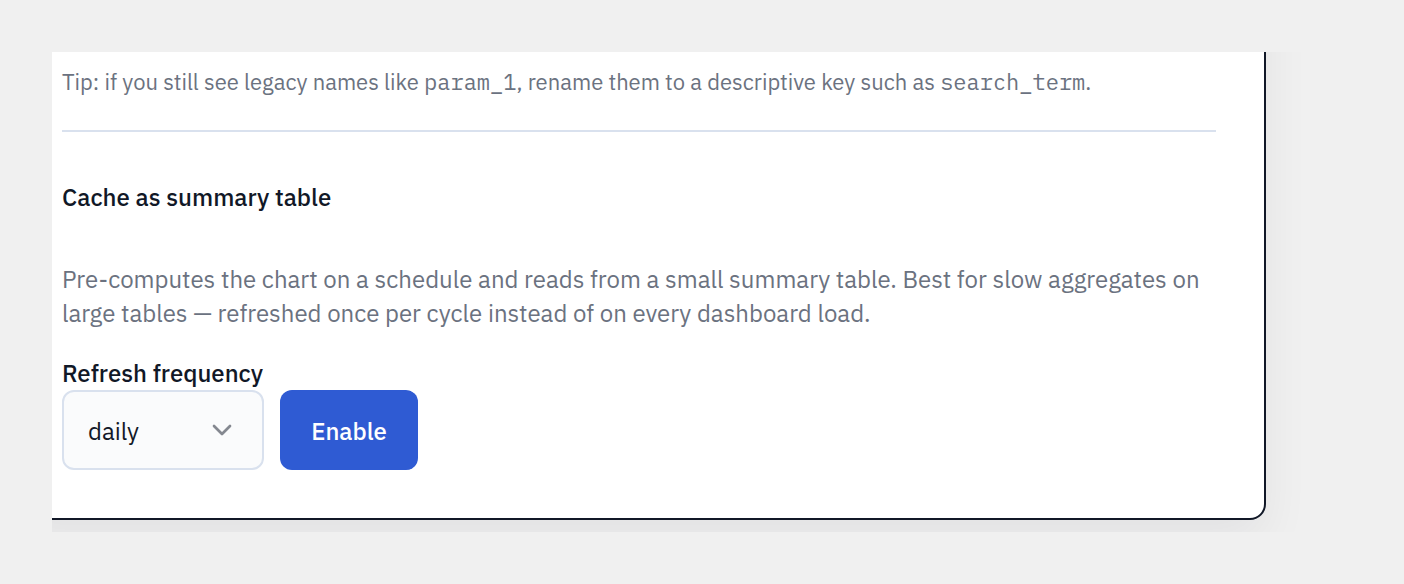
- 2Scroll to the Materialization section.
- 3Toggle “Enable materialization” on (Pro required — the toggle is shown but disabled on the free tier).
- 4Choose a refresh cadence: Hourly, Twice daily, or Daily.
- 5Save the chart. Glimpse BI creates a summary table and schedules the refresh.
- 6The chart now reads from the summary table and shows “Last refreshed”.
- 7Use Refresh now to rebuild on demand, or Disable to drop the table and return to live mode.
When to use it
Reach for materialization when a chart aggregates over millions of rows or joins several large tables and its live query is slow. The materialized read path sits under the same cache layer, so the two compose.
Safety
Editing a materialized chart’s definition automatically disables materialization and reverts it to live mode, because the projection may have changed — just re-enable when you’re done. Non-deterministic SQL (NOW(), RAND(), etc.) is rejected, and SQL-mode charts run live in v1.x.
Reference
Bring your WordPress data into focus.
Install the free plugin and build your first chart in minutes. Upgrade to Pro when you outgrow the caps.