← Docs
Documentation
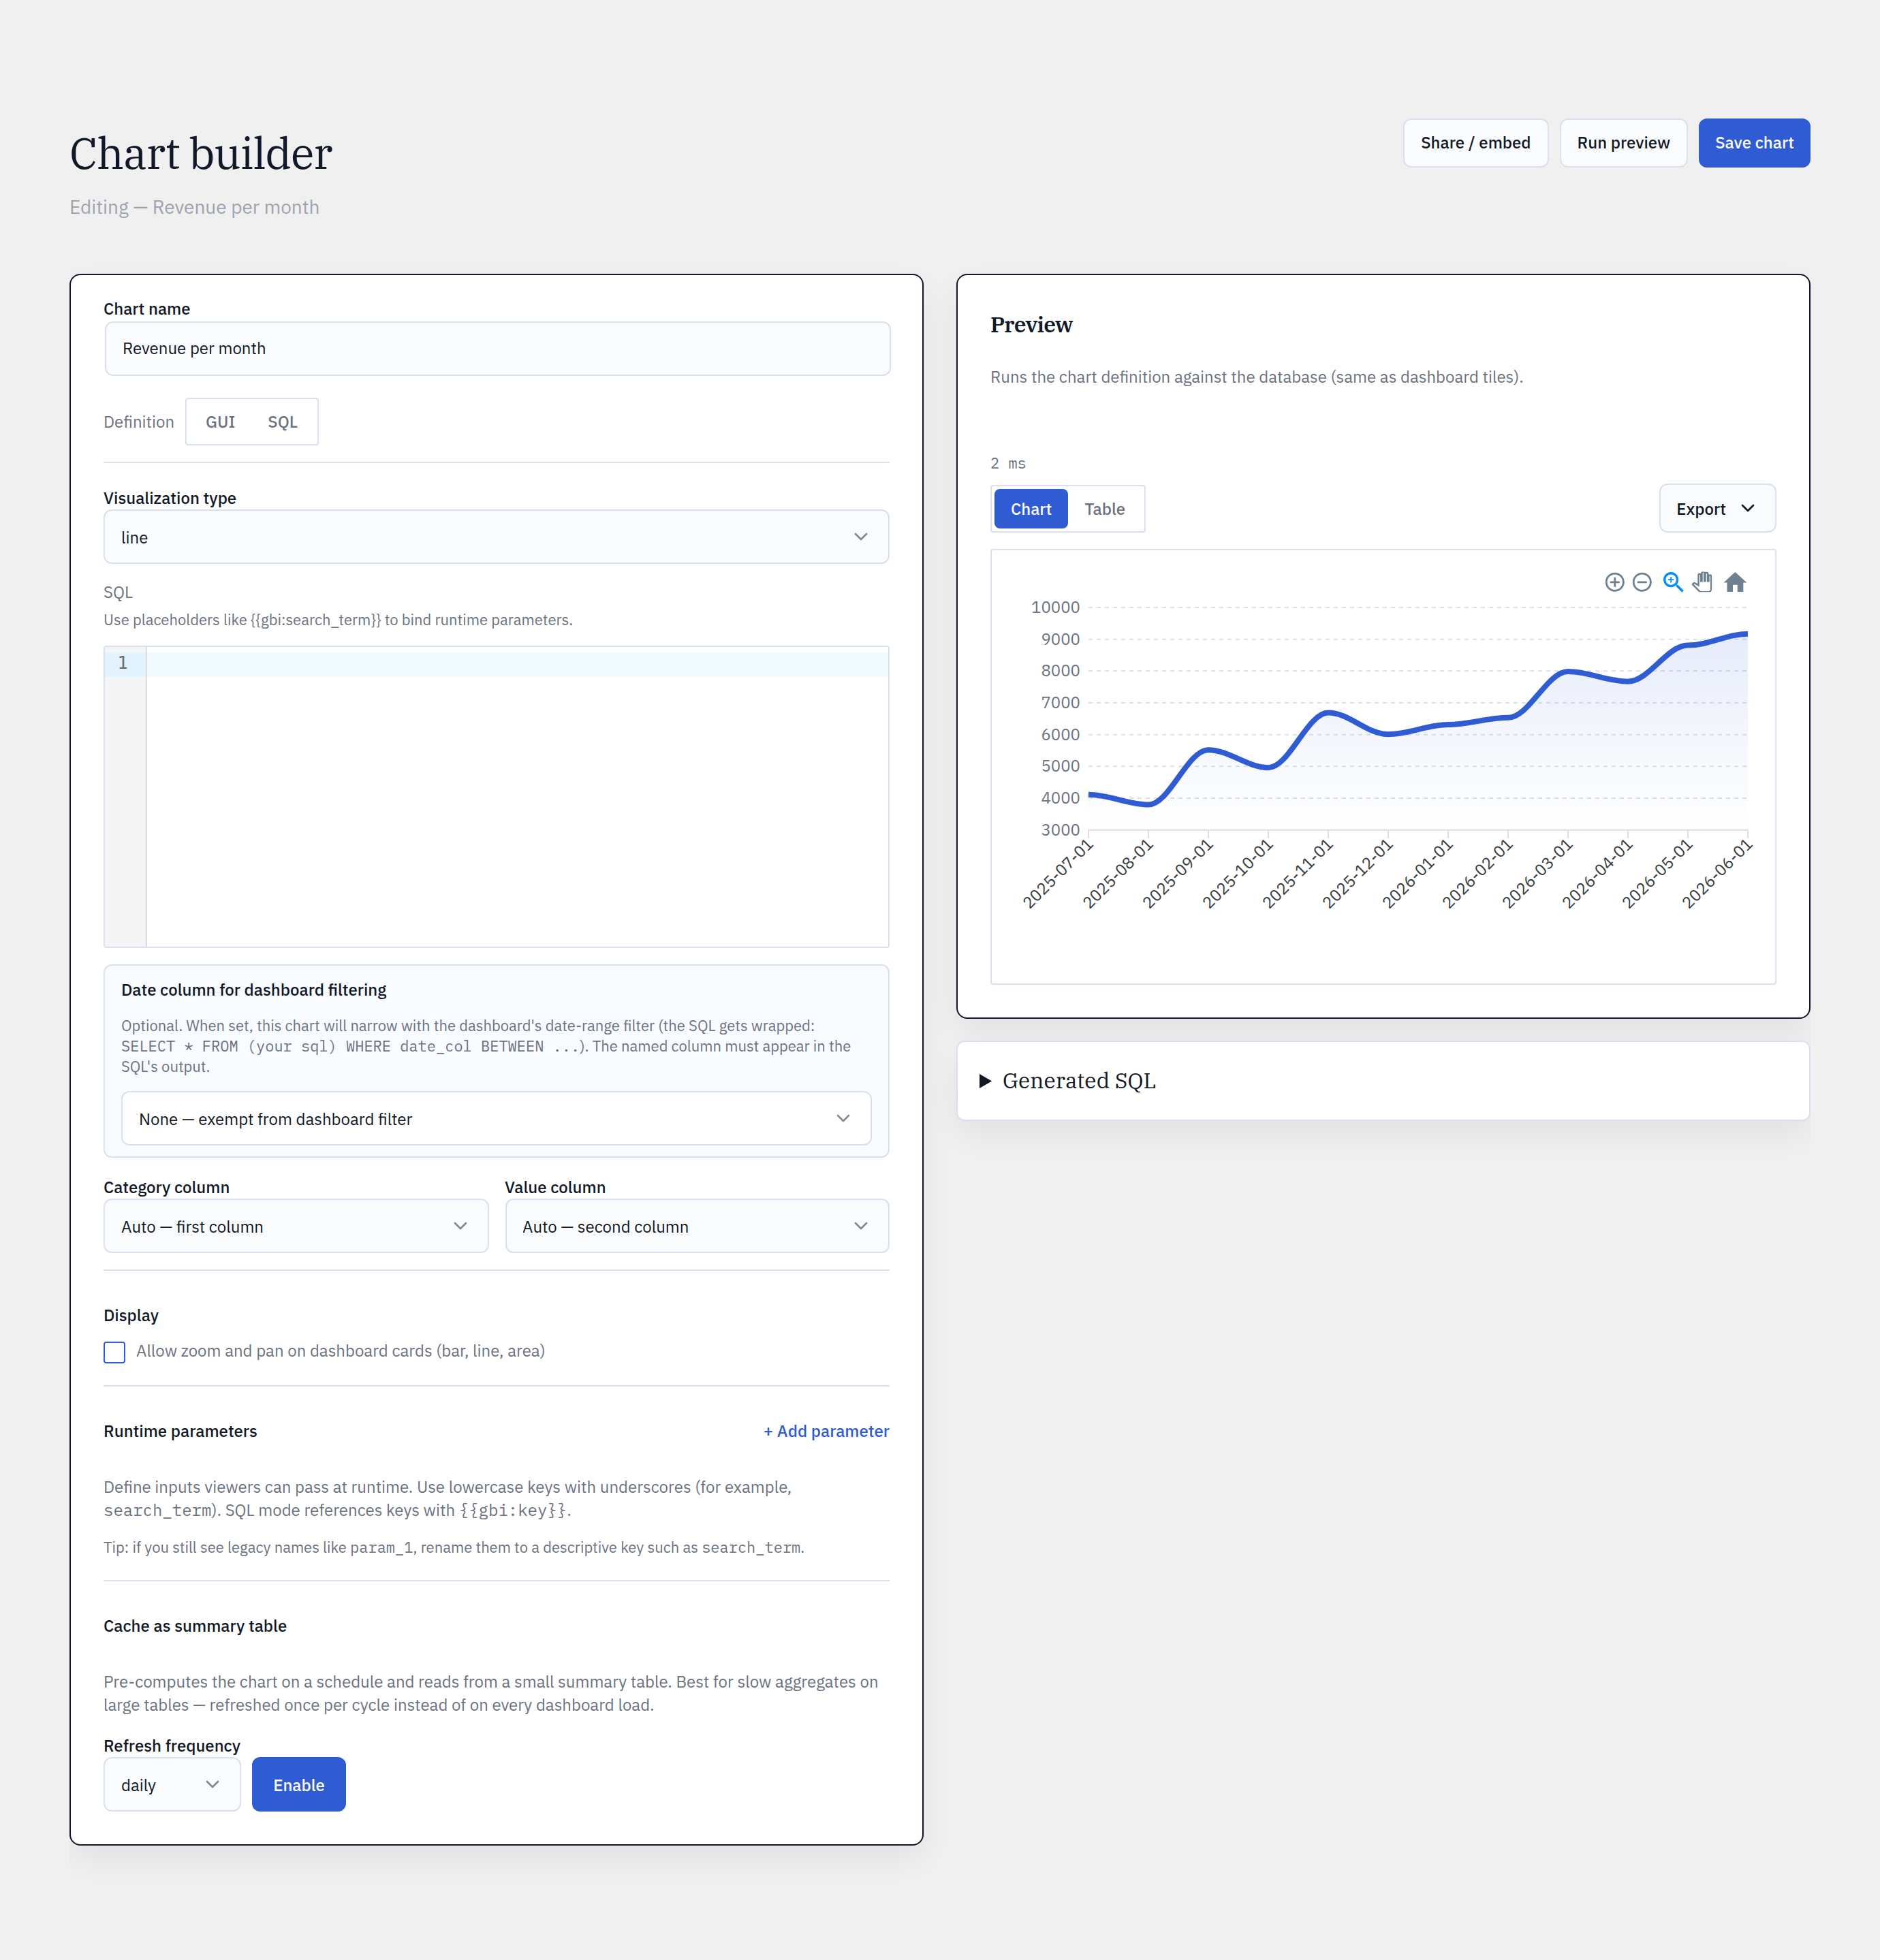
Build your first chart
The no-code GUI builder turns a table, an aggregate, and a dimension into a chart — with a live preview as you go. No SQL required.
Step by step
- 1Open Glimpse BI → Builder. You start on the GUI tab.
- 2Pick a Source table — every table in your database is listed (posts, users, WooCommerce orders, your own tables).
- 3Choose a Measure: Count, Sum, or Average. Sum and Average also need a numeric column.
- 4Add one or more Dimensions to group by — for a date column, pick a time bucket (day, week, month, quarter, year).
- 5Optionally add Filters (=, ≠, >, <, IN, BETWEEN, IS NULL, …) to narrow the rows.
- 6Pick a visualization type (KPI, line, bar, pie, table, heatmap), then click Run preview.
- 7Give the chart a name and Save. It now appears in Charts and can be pinned to any dashboard.
yoursite.com/wp-admin/admin.php?page=glimpsebi-builder
How the query is built
The GUI compiles to a parameterized, read-only SELECT: your measure becomes COUNT(*)/SUM(col)/AVG(col), dimensions become the GROUP BY (date buckets via DATE_FORMAT/YEARWEEK), and filters become a bound WHERE clause. Values are always passed through wpdb->prepare — never concatenated.
One chart, many dashboards
A chart is defined once and referenced by ID. Pin it to as many dashboards as you like; editing the chart updates every dashboard that shows it. Dashboards never copy charts, so there is no drift.
Reference
Measurescount · sum · avg
Date bucketsday · week · month · quarter · year
Filter operators= ≠ > < ≥ ≤ IN NOT IN BETWEEN IS (NOT) NULL LIKE
Definition storageJSON in post meta (_glimpsebi_def)
Default row limit10,000 (configurable)
Bring your WordPress data into focus.
Install the free plugin and build your first chart in minutes. Upgrade to Pro when you outgrow the caps.